Published Mar 23, 2026
Profit Factor in Trading Backtesting: Definition, Benchmarks, and Robust Strategy Evaluation

In the complex world of quantitative trading, where algorithms execute millions of trades per second, the distinction between a seemingly profitable backtest and a genuinely robust strategy can be razor-thin. Many aspiring traders, even those who think systematically, often overlook critical metrics beyond simple net profit, leading to strategies that fail to translate from historical data to live markets. One such fundamental yet frequently misinterpreted metric is the Profit Factor, a ratio that offers deep insights into a strategy's underlying efficiency and resilience.
Key Takeaways
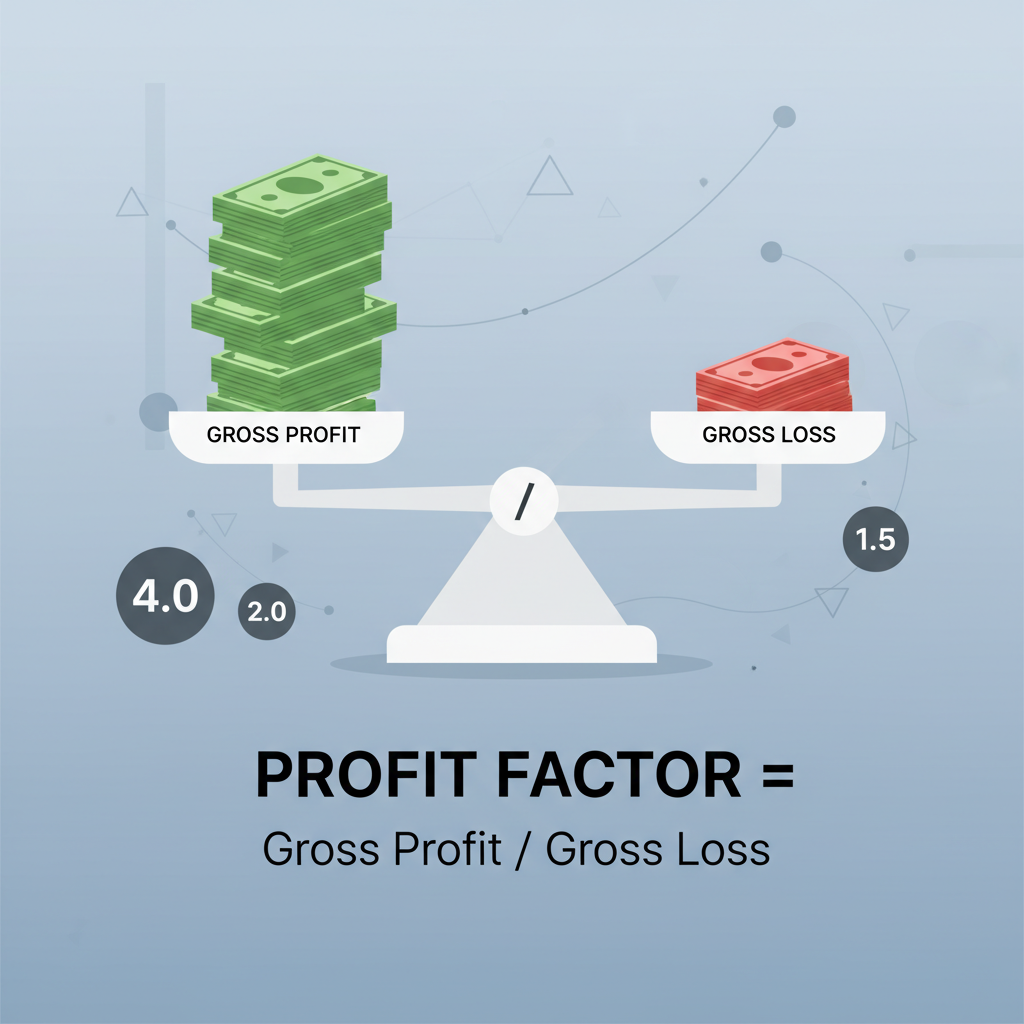
The Profit Factor is calculated as the ratio of total gross profit to total gross loss from a series of trades, offering a concise measure of a strategy's profitability per unit of risk.
A Profit Factor of 1.0 indicates a breakeven strategy, while a value below 1.0 signifies net losses; professional traders typically aim for a backtested Profit Factor between 1.5 and 1.75, with some considering 2.0+ as strong.
Extremely high Profit Factors (e.g., above 4.0) in backtesting can be a red flag for overfitting, suggesting the strategy is too tailored to past data and unlikely to perform robustly in diverse future market conditions.
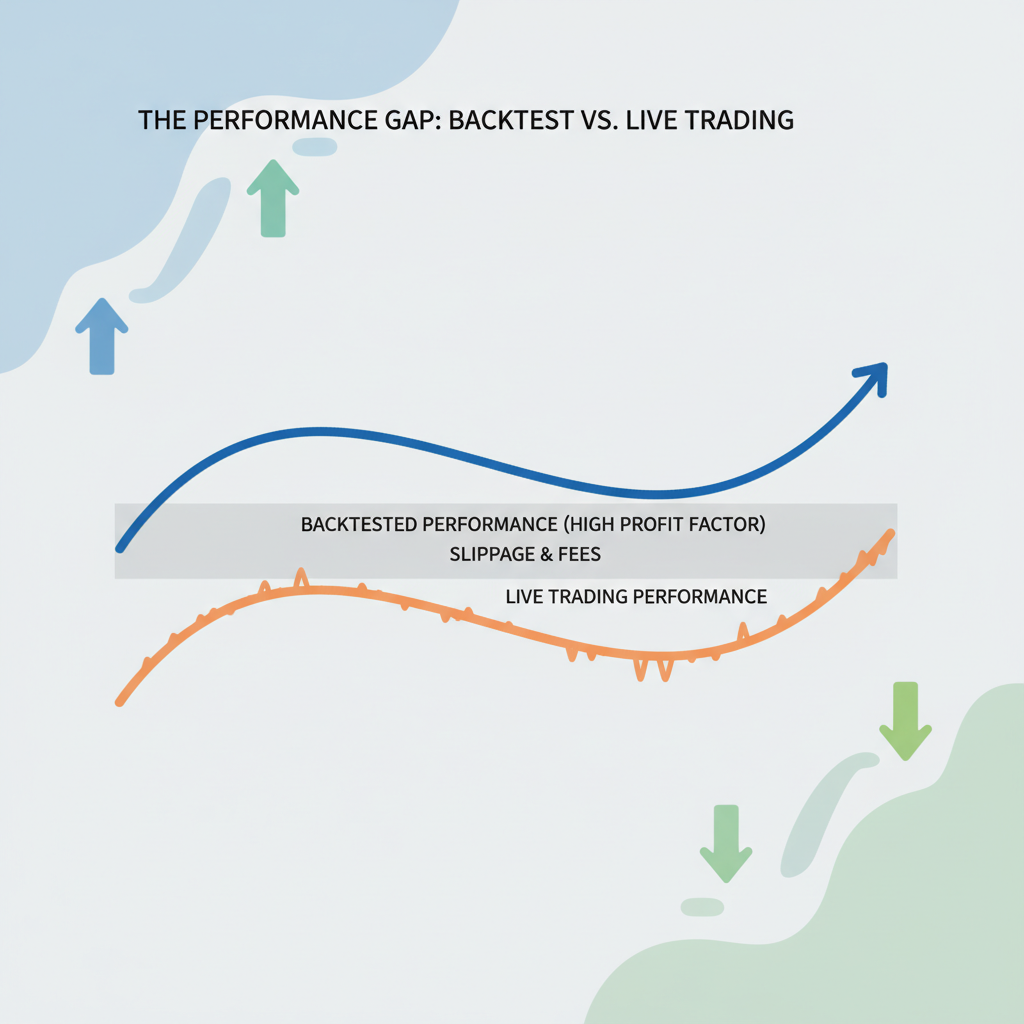
Live trading commonly sees a 10% to 20% underperformance compared to backtested results due to real-world factors like slippage, commissions, and execution delays, underscoring the need for a safety margin in backtested Profit Factors.
Robust strategy evaluation demands combining Profit Factor analysis with metrics like maximum drawdown, win rate, and out-of-sample testing, often complemented by Monte Carlo simulations to assess statistical reliability.
Understanding the Profit Factor: A Core Backtesting Metric
At its heart, the Profit Factor provides a clear snapshot of a trading strategy's efficiency by quantifying how much gross profit is generated for every dollar of gross loss. It is a simple yet profoundly insightful indicator for backtesters, offering a fundamental perspective on a model's inherent profitability.
The formula for Profit Factor is straightforward: Profit Factor = Total Gross Profit ÷ Total Gross Loss. As explained by BacktestMarket, if a strategy has a gross profit of $897.57 and a gross loss of $357.86, its Profit Factor would be 2.508. This implies that for every dollar lost, the strategy generates approximately $2.51 in profit. A Profit Factor of exactly 1.0 means the strategy breaks even, where gross profits equal gross losses, a scenario that is generally undesirable given the inherent risks of trading.
For example, if a strategy accumulates $10,000 in gross profits from all winning trades and incurs $5,000 in gross losses from all losing trades, the Profit Factor would be 2.0 (PineConnector). This simple ratio helps traders quickly assess the overall effectiveness and profitability of a strategy before committing capital. It's a backward-looking metric, reflecting what actually happened in the backtest, providing critical data for further analysis.
A Profit Factor of 2.4 means your strategy generates $2.4 in profit for every $1 lost, providing a clear measure of its efficiency. TraderSync
Actionable Takeaway: Always start your backtest analysis by calculating the Profit Factor. A value below 1.0 is an immediate red flag, indicating a fundamentally unprofitable strategy.
Interpreting Profit Factor: What Constitutes a "Good" Score?
While the calculation is simple, interpreting the Profit Factor effectively requires context and an understanding of established benchmarks. A higher Profit Factor is generally desirable, but there are nuanced thresholds that professional traders consider optimal, and even warnings against overly high values.
Generally, a Profit Factor above 1.5 is considered good, signifying that the strategy makes 50% more from winning trades than it loses from losing ones (FX Replay). For retail traders, a range between 1.5 and 3.0 is often considered good (PineConnector). BacktestBase further suggests that 1.5+ is good, and 2.0+ is strong.
However, professional traders often aim for a backtested Profit Factor between 1.5 and 1.75 to build in a safety margin (QuantVPS). This cautious approach is rooted in the understanding that live trading environments introduce factors like slippage, commissions, and execution delays, which can degrade performance. An example provided by QuantVPS notes that a backtested Profit Factor of 1.8 might realistically drop to around 1.5 or 1.6 in live markets.
Conversely, an excessively high Profit Factor, particularly above 4.0, can be a sign of overfitting, especially if the strategy has many parameters and is overly optimized for a specific historical dataset (QuantVPS). Such strategies, while appearing exceptional in backtests, often fail to adapt to new market conditions and can perform poorly in live trading. This is why Oddmund Groette from Quantified Strategies suggests that a good profit factor should be "more than 1.75 but preferably not above 4."
The optimal Profit Factor can also vary based on the trading style. Trend-following strategies, for instance, might naturally exhibit higher Profit Factors due to capturing large price moves, whereas mean-reversion strategies might have lower Profit Factors but with frequent small gains (PineConnector).
Actionable Takeaway: Aim for a backtested Profit Factor between 1.5 and 3.0. Be wary of values above 4.0, as they may indicate overfitting. Always consider the strategy's trading style and desired risk profile when setting benchmarks.
Profit Factor vs. Other Performance Metrics: A Holistic View
While the Profit Factor is a powerful metric, it should never be evaluated in isolation. A comprehensive assessment of a trading strategy requires combining the Profit Factor with other critical performance indicators to build a holistic understanding of its strengths, weaknesses, and overall robustness.
Profit Factor vs. Win Rate
The win rate, or percentage of winning trades, is another commonly used metric. However, a high win rate alone does not guarantee profitability. A strategy could have an 80% win rate but still be unprofitable if the average loss on the remaining 20% of trades is significantly larger than the average profit on winning trades. Conversely, a strategy with a low win rate (e.g., 30%) could be highly profitable if its winning trades are substantially larger than its losing trades.
The Profit Factor intrinsically incorporates both the win rate and the average profit/loss per trade, offering a more complete picture of profitability. A strategy with a Profit Factor of 2.0, for example, is inherently more robust than one with a high win rate but a low Profit Factor.
Profit Factor vs. Risk-Reward Ratio
The Risk-Reward Ratio is a forward-looking metric that measures the potential gain versus potential loss for a single trade (e.g., 2:1 means risking $100 to make $200). It's a target set before entering a trade. The Profit Factor, in contrast, is a backward-looking metric that measures actual historical performance across all trades (BacktestBase). A key insight is that a target 3:1 risk-reward ratio might only yield a 1.8 Profit Factor in practice due to imperfect execution, early exits, and unforeseen market conditions.
Profit Factor vs. Expectancy
Expectancy is a single number representing the average profit or loss a trader can expect per trade over the long run. It combines win rate, average win, and average loss into one value. While related, Profit Factor provides a ratio of gross profitability, whereas Expectancy gives a dollar value per trade. Both are crucial for understanding long-term viability.
Best practice dictates combining Profit Factor with drawdown analysis, sample size validation, and Monte Carlo testing for a complete picture (BacktestBase). This multi-metric approach helps identify strengths, weaknesses, and potential risk factors, transforming raw backtest data into actionable insights (FX Replay).
Actionable Takeaway: Never rely on Profit Factor alone. Always pair it with other metrics like maximum drawdown, Sharpe Ratio, and win rate. Use Monte Carlo simulations to assess the statistical significance and potential range of your Profit Factor over many hypothetical futures.
The Critical Role of Backtesting and Bridging the Gap to Live Performance
Backtesting is the bedrock of systematic trading, allowing traders to simulate strategies against historical data to evaluate their potential. However, the true challenge lies in ensuring that a strategy's impressive backtested Profit Factor translates into similar performance in live trading. This gap is a common pitfall for many traders.
Ensuring Robust Backtesting
The reliability of your Profit Factor is directly tied to the quality and depth of your backtesting. A crucial element is the sample size. Testing a strategy over too few trades or only in one specific type of market (e.g., only trending markets) leads to unreliable results. A large and diverse sample helps validate a strategy's robustness and generalizability (FX Replay). For instance, a strategy showing a Profit Factor of 2.50 on one asset might only be robust if it maintains profitability across other futures, stocks, or commodities (BacktestMarket).
Furthermore, avoiding overfitting is paramount. Over-optimization, where a strategy is meticulously tuned to perform perfectly on a specific historical dataset, often results in a high backtested Profit Factor that crumbles in live conditions. Strategies with fewer parameters and less optimization tend to be more robust for future market movements.
Addressing Real-World Discrepancies
Professional traders acknowledge that live trading often underperforms backtests by 10% to 20% (QuantVPS). This reduction in performance is primarily due to:
Slippage: The difference between the expected price of a trade and the price at which the trade is actually executed.
Commissions and Fees: Transaction costs that eat into gross profits.
Execution Delays: Latency between the signal generation and the order reaching the broker, leading to suboptimal entry/exit points.
This is why maintaining a backtested Profit Factor above 1.75 is often recommended, as it provides a necessary buffer to absorb these real-world trading costs and still remain profitable (QuantVPS). A backtested Profit Factor of 2.0, for example, might realistically drop below 1.5 in live trading due to these factors, making the selection of a robust execution infrastructure just as critical as the strategy itself.
Actionable Takeaway: Conduct thorough backtesting across diverse market conditions and multiple assets to validate your Profit Factor. Assume a 10-20% degradation in live performance and ensure your backtested Profit Factor has sufficient margin to remain profitable after accounting for slippage and fees.
How Horizon Addresses This
For serious traders who seek to systematically transform their trading ideas into automated execution, Horizon offers a comprehensive platform designed to address the challenges of profit factor definition, robust backtesting, and bridging the gap to live performance.
AI Strategy Generation: Horizon allows you to generate custom trading strategies using AI, removing the coding barrier. This enables you to quickly iterate and test multiple strategies, each with a calculated Profit Factor, without manual coding effort.
Institutional-Grade Backtesting: Our platform provides a sophisticated backtesting engine that delivers detailed performance metrics, including Profit Factor, Sharpe Ratio, maximum drawdown, and out-of-sample backtesting. This ensures you receive statistically reliable results, far beyond what basic tools offer.
Robustness Validation: Horizon goes beyond simple historical tests. You can perform Monte Carlo simulations to assess the statistical significance and potential variance of your Profit Factor under various market conditions, helping identify true robustness versus mere curve-fitting. Our heatmaps also visualize strategy performance across different parameters, helping you avoid over-optimization.
Real-time Performance Monitoring: Once deployed, strategies are continuously monitored with real-time analytics. This allows you to track the actual Profit Factor and other key metrics in a live environment, quickly identifying any degradation due to real-world trading frictions like slippage and commissions, and adjusting as needed.
Multi-Asset Support: Test your strategies and their Profit Factors across stocks, forex, crypto, futures, and options, ensuring your strategy's performance is not limited to a single market. This breadth helps confirm the generalizability and robustness of your Profit Factor.
By providing advanced tools for strategy creation, rigorous evaluation, and real-time monitoring, Horizon empowers traders to achieve higher confidence in their backtested Profit Factors and bridge the critical gap to profitable live trading. Explore how Horizon can elevate your algorithmic trading journey.
Conclusion
The Profit Factor is more than just a number; it is a critical lens through which systematic traders can evaluate the underlying health and efficiency of their strategies. Understanding its definition, interpreting its benchmarks, and integrating it with other robust backtesting methodologies are indispensable steps in developing trading systems that genuinely perform in live markets. As the landscape of quantitative trading continues to evolve, the ability to accurately assess and validate performance metrics like the Profit Factor will distinguish consistently profitable traders from those who merely chase historical anomalies. Embrace a rigorous, data-driven approach to backtesting, and ensure your strategies possess the inherent profitability demanded by the market.

