
Cerebras has only a short public earnings history.
That makes every new event useful.
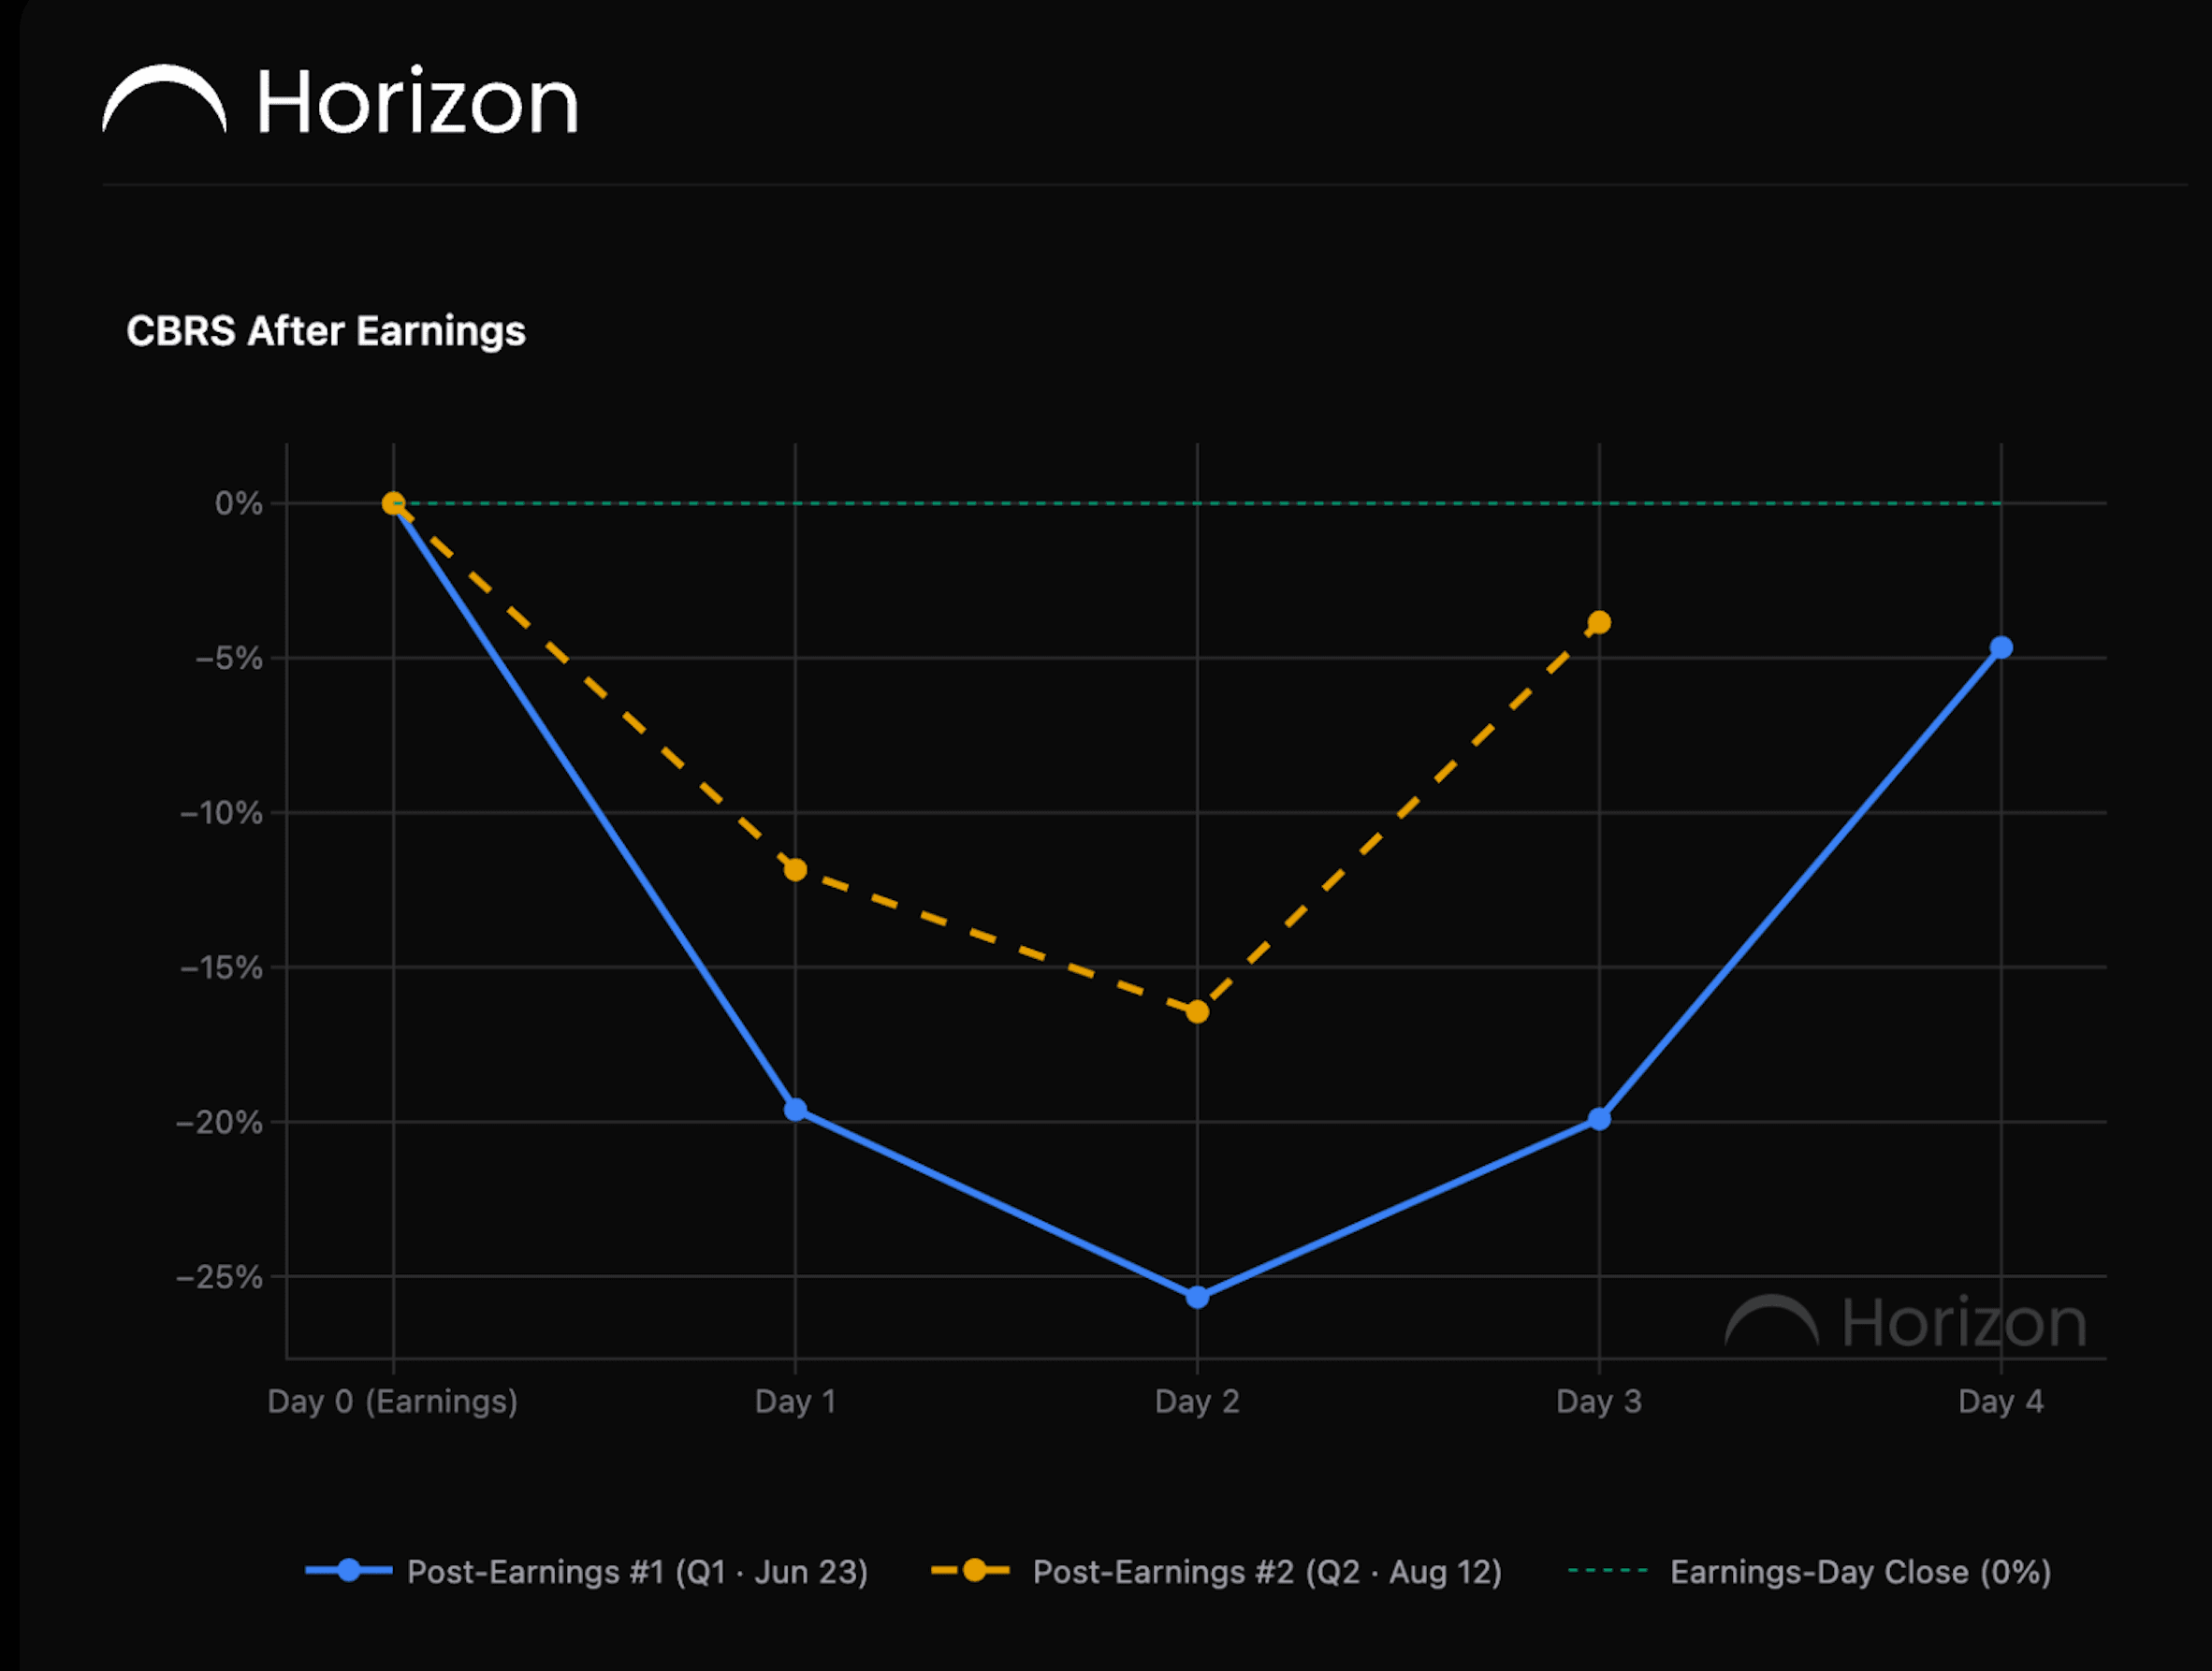
After the company's first earnings report, the stock sold off sharply, weakened further over the next two sessions, then snapped back.
The second earnings report has now produced almost the same sequence.
The first event
After Q1 earnings, CBRS fell roughly 19.6% on the initial reaction.
The selloff deepened to around 26% by Day 2.
Then the stock reversed sharply.
By Day 4, the decline had narrowed to roughly 5%.
That created a simple pattern: earnings selloff, further weakness, then aggressive mean reversion.
Q2 followed the same shape
After Q2 earnings, CBRS fell around 11.9% on Day 0.
By Day 2, the decline had deepened to roughly 16%.
Then the rebound arrived.
By Day 3, the stock was only around 4% below the earnings-day reference.
The magnitude was different.
The sequence was remarkably similar.
Why the live aspect matters
The useful part of this setup is that the reversal pattern was identified while Q2 was still unfolding.
It was not fitted after the rebound had already happened.
That makes the event more informative as a live market observation.
The research identified the broad shape first.
The second event then followed it.
The sample is still tiny
There have only been two public earnings events.
That is nowhere near enough to call this a statistically proven edge.
Two similar paths can still be coincidence.
The value is in tracking whether a third and fourth report produce the same behaviour.
The takeaway
Cerebras has now produced the same broad post-earnings sequence twice.
The stock sold off hard, weakened further over the next one or two sessions, then mean reverted sharply back toward the earnings-day close.
The second reversal played out after the pattern had already been identified.
That makes it interesting.
It does not make it proven.
Share this post: