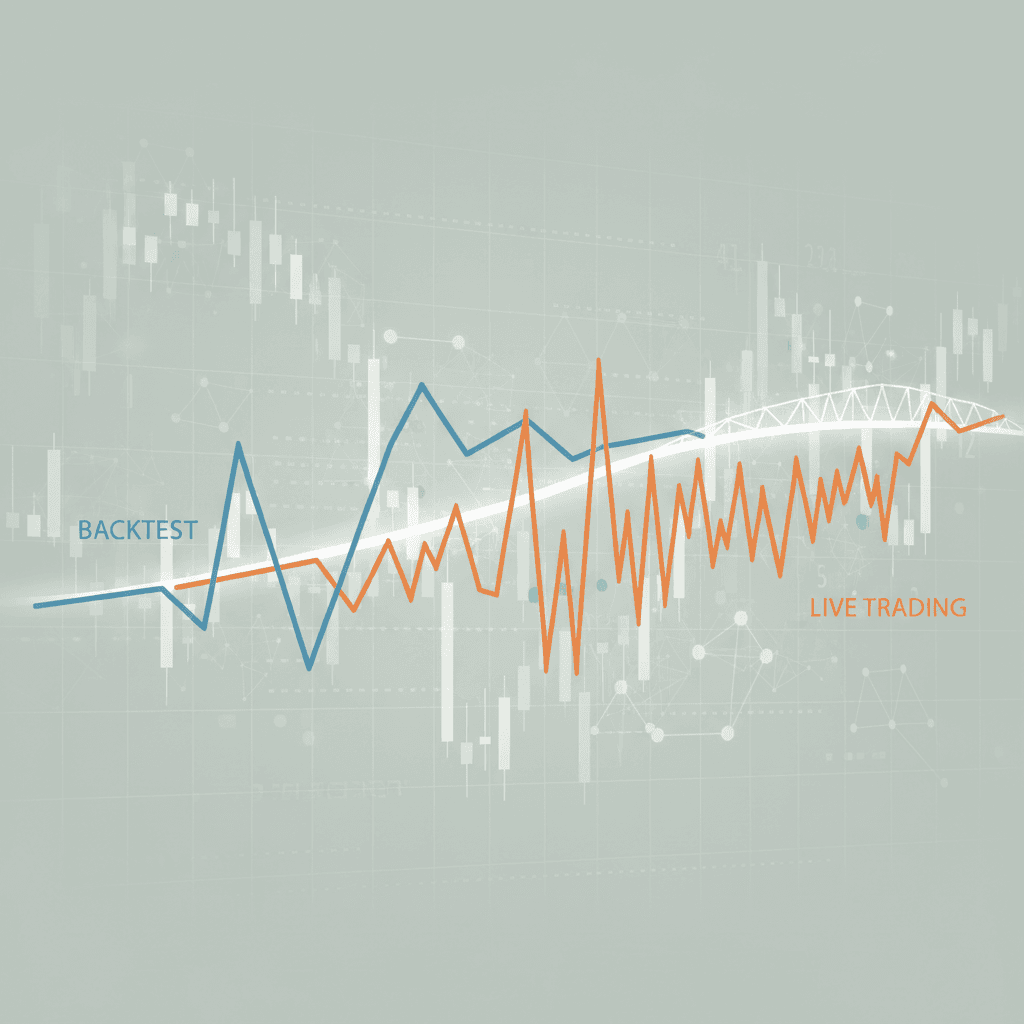
Almost every systematic trader has the same experience the first time a strategy goes live. The backtest showed a steady equity curve and a drawdown they could live with. The live account shows smaller profits, or losses, and a drawdown deeper than anything in the test. The strategy did not change. The conditions did.
This guide goes through the reasons a live result diverges from its backtest, how to measure the gap once you are trading, and what to change on each side to close it.
Expect a gap, then measure it
A backtest runs fixed rules over fixed history with assumed fills. Live trading runs the same rules on a data feed that arrives in real time, through a broker that fills orders at whatever price is available. Some gap is unavoidable. The useful question is how large it is and where it comes from.
Measure it directly. After the strategy has been live for a few weeks, rerun the backtest over exactly those dates and compare trade by trade: the same entries on the same bars, the fill prices, the exits, and the resulting profit and loss. Every difference you find falls into one of the buckets below, and each bucket has its own fix.
Bucket one: execution costs the backtest did not charge
The most common difference is in the fills. A backtest that assumes entry at the signal bar's close is assuming a price nobody could have traded at, because the bar had closed by the time the signal was known. Live, the order goes in on the next bar and fills somewhere inside its range.
Three costs sit in this bucket:
- Slippage. The difference between the price the backtest assumed and the price the order filled at. It grows with order size, volatility and thin liquidity, and it is worst around the open, around news and in fast markets.
- Spread. Every round trip crosses the bid-ask spread once. A backtest on mid prices ignores it entirely.
- Commission and fees. Small per trade, large for a strategy that trades often.
The fix is to put realistic costs into the backtest and rerun it. If a strategy's average profit per trade is a fraction of a percent, costs of that size decide whether it is profitable at all. A strategy that only works with zero slippage does not work.
Bucket two: the rules behave differently on live data
The second bucket is subtler. The strategy's logic is the same, but the data it sees is not. A backtest knows the full bar, including its close, at the moment it evaluates a signal. A live system sees the bar form tick by tick. If any rule acts on a value that was not final when the order went out, the live trades will not match the backtested ones.
Common examples are indicators computed on the current bar's close, stops that assume a fill at the stop price when the market gapped past it, and strategies that hold more positions live than the backtest allowed because an exit order failed or filled late. Each of these shows up clearly in the trade-by-trade comparison. The fix is to make the backtest act on the same information the live system has, which usually means signalling on the closed bar and executing on the next one.
Bucket three: the market moved on
A strategy tuned on a trending market will underperform in a ranging one, and the reverse. This is not a bug in the backtest. It is a reminder that the backtest covers the past and the live period is a new sample. A strategy that made most of its backtested profit in one favourable stretch is more exposed to this than one that earned steadily across different regimes.
The check here is in the backtest's own history. Split it into years or into regimes and see whether the strategy was profitable in most of them. If it was not, the live period is as likely to land in a bad regime as a good one. Walk-forward testing, which re-tunes on one period and tests on the next, is the formal version of this check. See walk-forward optimization.
Bucket four: drawdown, the number that gets you to stop
Most traders judge a backtest by its return. The number that decides whether they keep trading the strategy is its drawdown, the largest fall from a peak in the equity curve. Live drawdowns feel worse than backtested ones for two reasons. The money is real, and the drawdown is happening now rather than being a dip on a chart you can see the recovery from.
A backtest's maximum drawdown is also only the worst case that happened in that sample. The live period can produce a deeper one, and often does early on, because the strategy went live at the end of a good run that made it look attractive. Plan for a live drawdown larger than the backtest's maximum, and decide in advance at what point you will stop the strategy and review it. A strategy you cannot hold through its normal drawdown is not tradable for you, whatever its return.
Two other backtest numbers are worth reading alongside drawdown. Profit factor, gross profit divided by gross loss, says how much margin the edge has over its losses. A value close to one leaves no room for the execution costs above. Trade count says how much evidence the backtest contains. A strategy with thirty trades over ten years has not been tested; it has been observed.
Bucket five: the trader in the loop
The last gap is between the rules and the person applying them. A backtest never hesitates, never skips a signal because the last three lost, and never takes profit early because the position looked good. A trader placing orders by hand does all of these, and the result is a live record that follows the strategy only on the days it was comfortable to follow.
This is the gap automation closes outright. An automated strategy places the entry and the exit the moment the rule fires, at the size the rule specifies. The remaining differences are then execution and data, both of which you can measure and fix. Discipline is no longer one of the variables.
How Horizon fits
Horizon runs the same strategy in all three stages. You describe the rules in plain English and backtest them, with costs included, over the dates you choose. The backtest reports the Sharpe ratio, maximum drawdown, win rate, profit factor and the full trade list, which is what you need for the trade-by-trade comparison above.
You then paper trade the strategy on live market data. That is where execution and data differences show up without costing anything, and it is the step most traders skip. When the paper trades match the backtest, you deploy the same strategy to a connected broker, and the rules execute without a person in the loop. For the full workflow, see how to use Horizon effectively.
Frequently asked questions
How much worse should I expect live results to be?
There is no fixed ratio, because it depends on how much the backtest already charged for costs and how often the strategy trades. The honest answer comes from the trade-by-trade comparison after a few weeks live.
Should I stop a strategy as soon as live results fall behind the backtest?
No. Decide the stopping rule before going live, usually a drawdown somewhat beyond the backtest's maximum, and apply that. Stopping on the first bad week throws out good strategies along with bad ones.
Is paper trading a reliable preview of live trading?
It is reliable for data and timing differences, and for whether the rules behave as tested. It understates slippage, because paper fills do not move the market. Treat it as necessary, not sufficient.
Does automation fix the backtest-to-live gap?
It removes the human part of it, which is often the largest. The execution and data parts remain and have to be measured and modelled into the backtest.
Close the gap before you fund it
Charge the backtest for real costs, make the rules act on the data they will have live, paper trade until the trades match, and let the system execute. Horizon runs each step from a plain-English description, with no code.
Share this post: