
Gold is up 14.6% in August 2026.
That puts the metal into a very rare momentum regime.
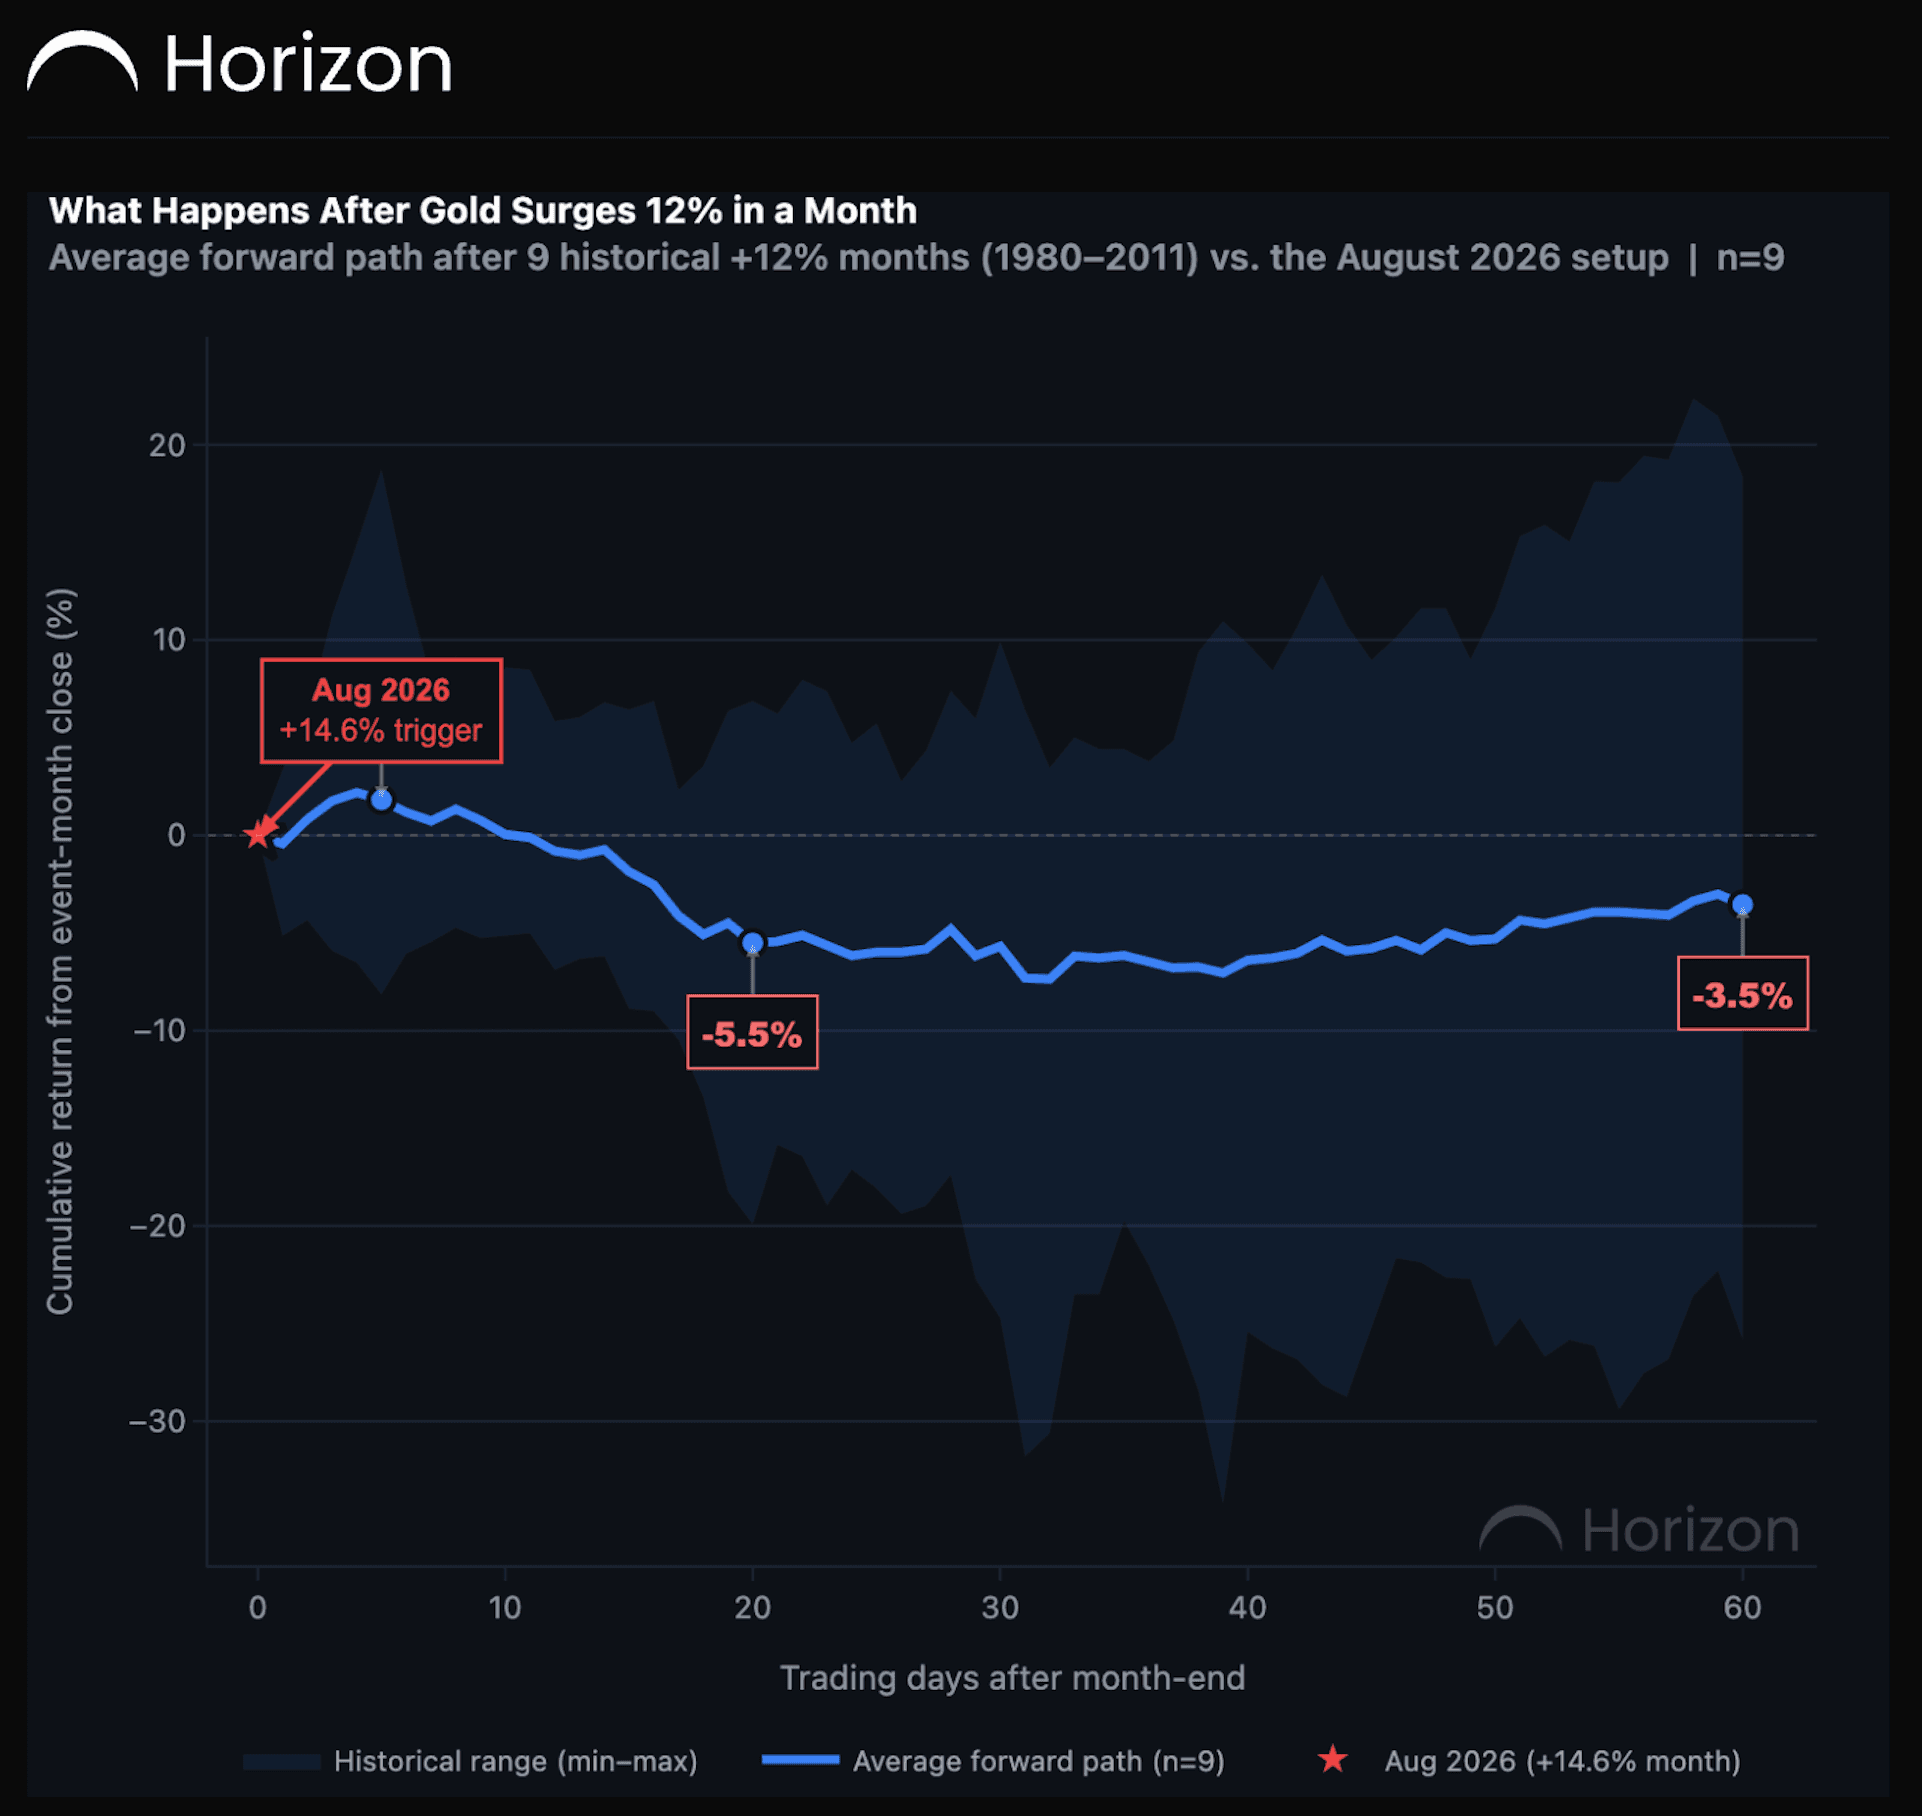
We looked back at every calendar month since 1980 where gold gained at least 12% and measured what happened over the following 60 trading days.
There were only nine historical events.
The average path was not continued momentum.
The first few sessions were still positive
After these extreme monthly rallies, gold initially pushed a little higher.
The average early extension was around +1.8%.
That matters because the historical pattern was not an immediate reversal.
The weakness appeared later.
By one month, the average path was negative
By Day 20, the average return from the month-end trigger had fallen to roughly -5.5%.
By Day 60, gold was still around -3.5% on average.
That is a meaningful deterioration from the first few sessions.
The strongest part of the move had usually already happened by the time the 12% monthly threshold was reached.
Why extreme momentum can become harder to sustain
A 12% to 15% monthly move compresses a large amount of repricing into a short period.
That does not mean the underlying thesis is wrong.
It does mean positioning, sentiment and valuation can become stretched.
Once the immediate catalyst has been absorbed, the market may need time to consolidate before another leg higher.
The dispersion was still wide
There were only nine comparable months.
Some continued much higher.
Others reversed sharply.
That makes this a historical tendency rather than a deterministic signal.
The average path is useful because it shows what usually happened.
It does not tell us what must happen next.
The current move is even larger than the threshold
August 2026 is already up 14.6%.
That puts the current event comfortably inside the extreme group.
The most relevant historical window is therefore not the next session.
It is the next one to three months.
The takeaway
Very strong monthly gold momentum has historically been followed by weaker forward returns rather than clean continuation.
Across nine comparable months since 1980, the average path moved from a small early gain to -5.5% by Day 20 and remained negative at Day 60.
Gold does not have to reverse immediately.
History suggests the easy part of the move may already have happened.
Share this post: