
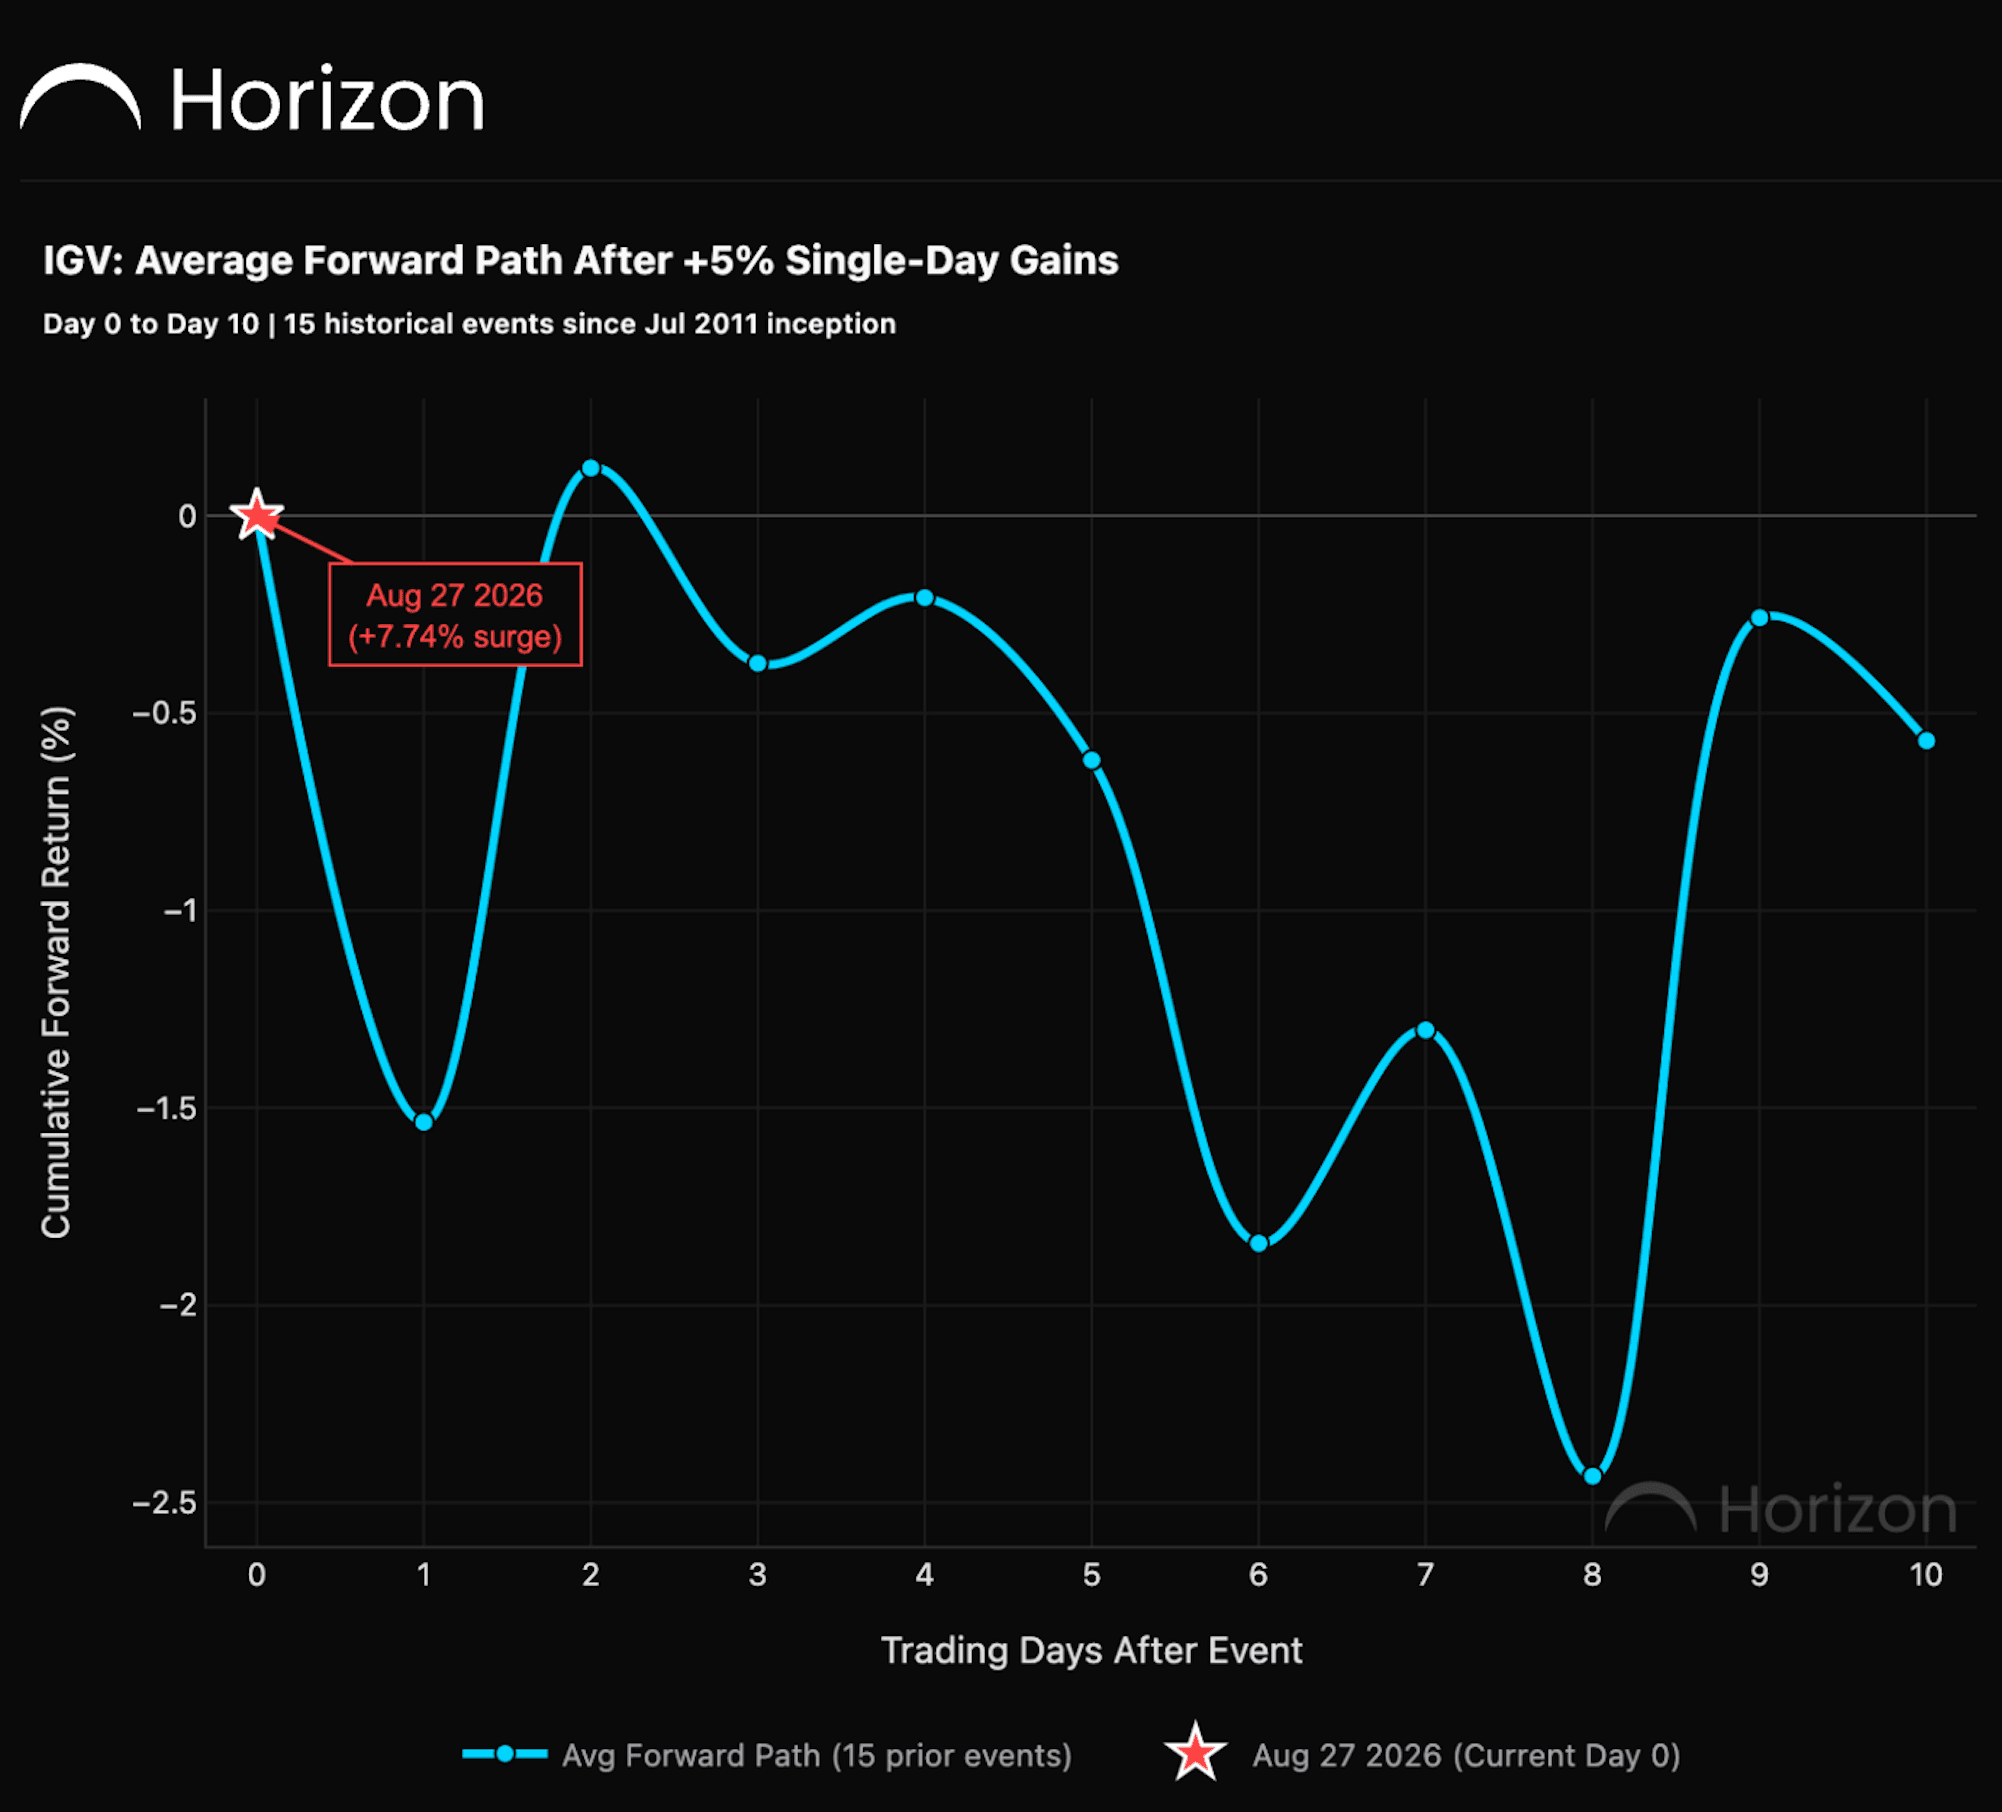
The iShares Expanded Tech-Software Sector ETF, IGV, surged 7.74% on August 27.
Moves that large are rare.
Since the ETF's 2011 inception, there have been only 15 previous sessions where IGV gained at least 5% and had enough forward data to study.
The historical pattern was not continued momentum.
It was mean reversion.
The next day was usually weaker
After prior 5%-plus single-day gains, IGV averaged -1.54% on Day +1.
Only 33% of events were positive.
That means two-thirds of the historical examples gave back at least some of the initial surge in the next session.
By Day +5, the average return was still negative at -0.62%.
By Day +10, it was -0.57%.
The rebound was uneven
The average path briefly moved back above zero on Day +2.
After that, it weakened again.
The lowest point arrived around Day +8, where the average return reached -2.43%.
There was some recovery into Day +10, but not enough to erase the broader mean-reversion pattern.
Why large one-day moves often struggle
A 7% to 8% sector move compresses a lot of repricing into a single session.
That can happen because of a major change in earnings expectations, rates, regulation or positioning.
Once the price jumps that far, the next buyer is paying a much higher price for information the market already knows.
That often reduces the short-term momentum edge.
The current setup
August 27 is now Day 0.
Historically, chasing a 5%-plus IGV surge has been a poor short-term momentum trade.
The following session averaged a 1.54% give-back, and only one-third of prior events finished Day +1 higher.
The current move is even larger than the threshold used in the study.
That makes it worth tracking as the forward path develops.
The takeaway
Extreme IGV up-days have historically been followed by mean reversion rather than clean continuation.
Across 15 prior events, the ETF was lower on average one, five and ten trading days later.
A huge software rally can feel like the start of a momentum burst.
History suggests the easier part of the move may already have happened.
Share this post: