
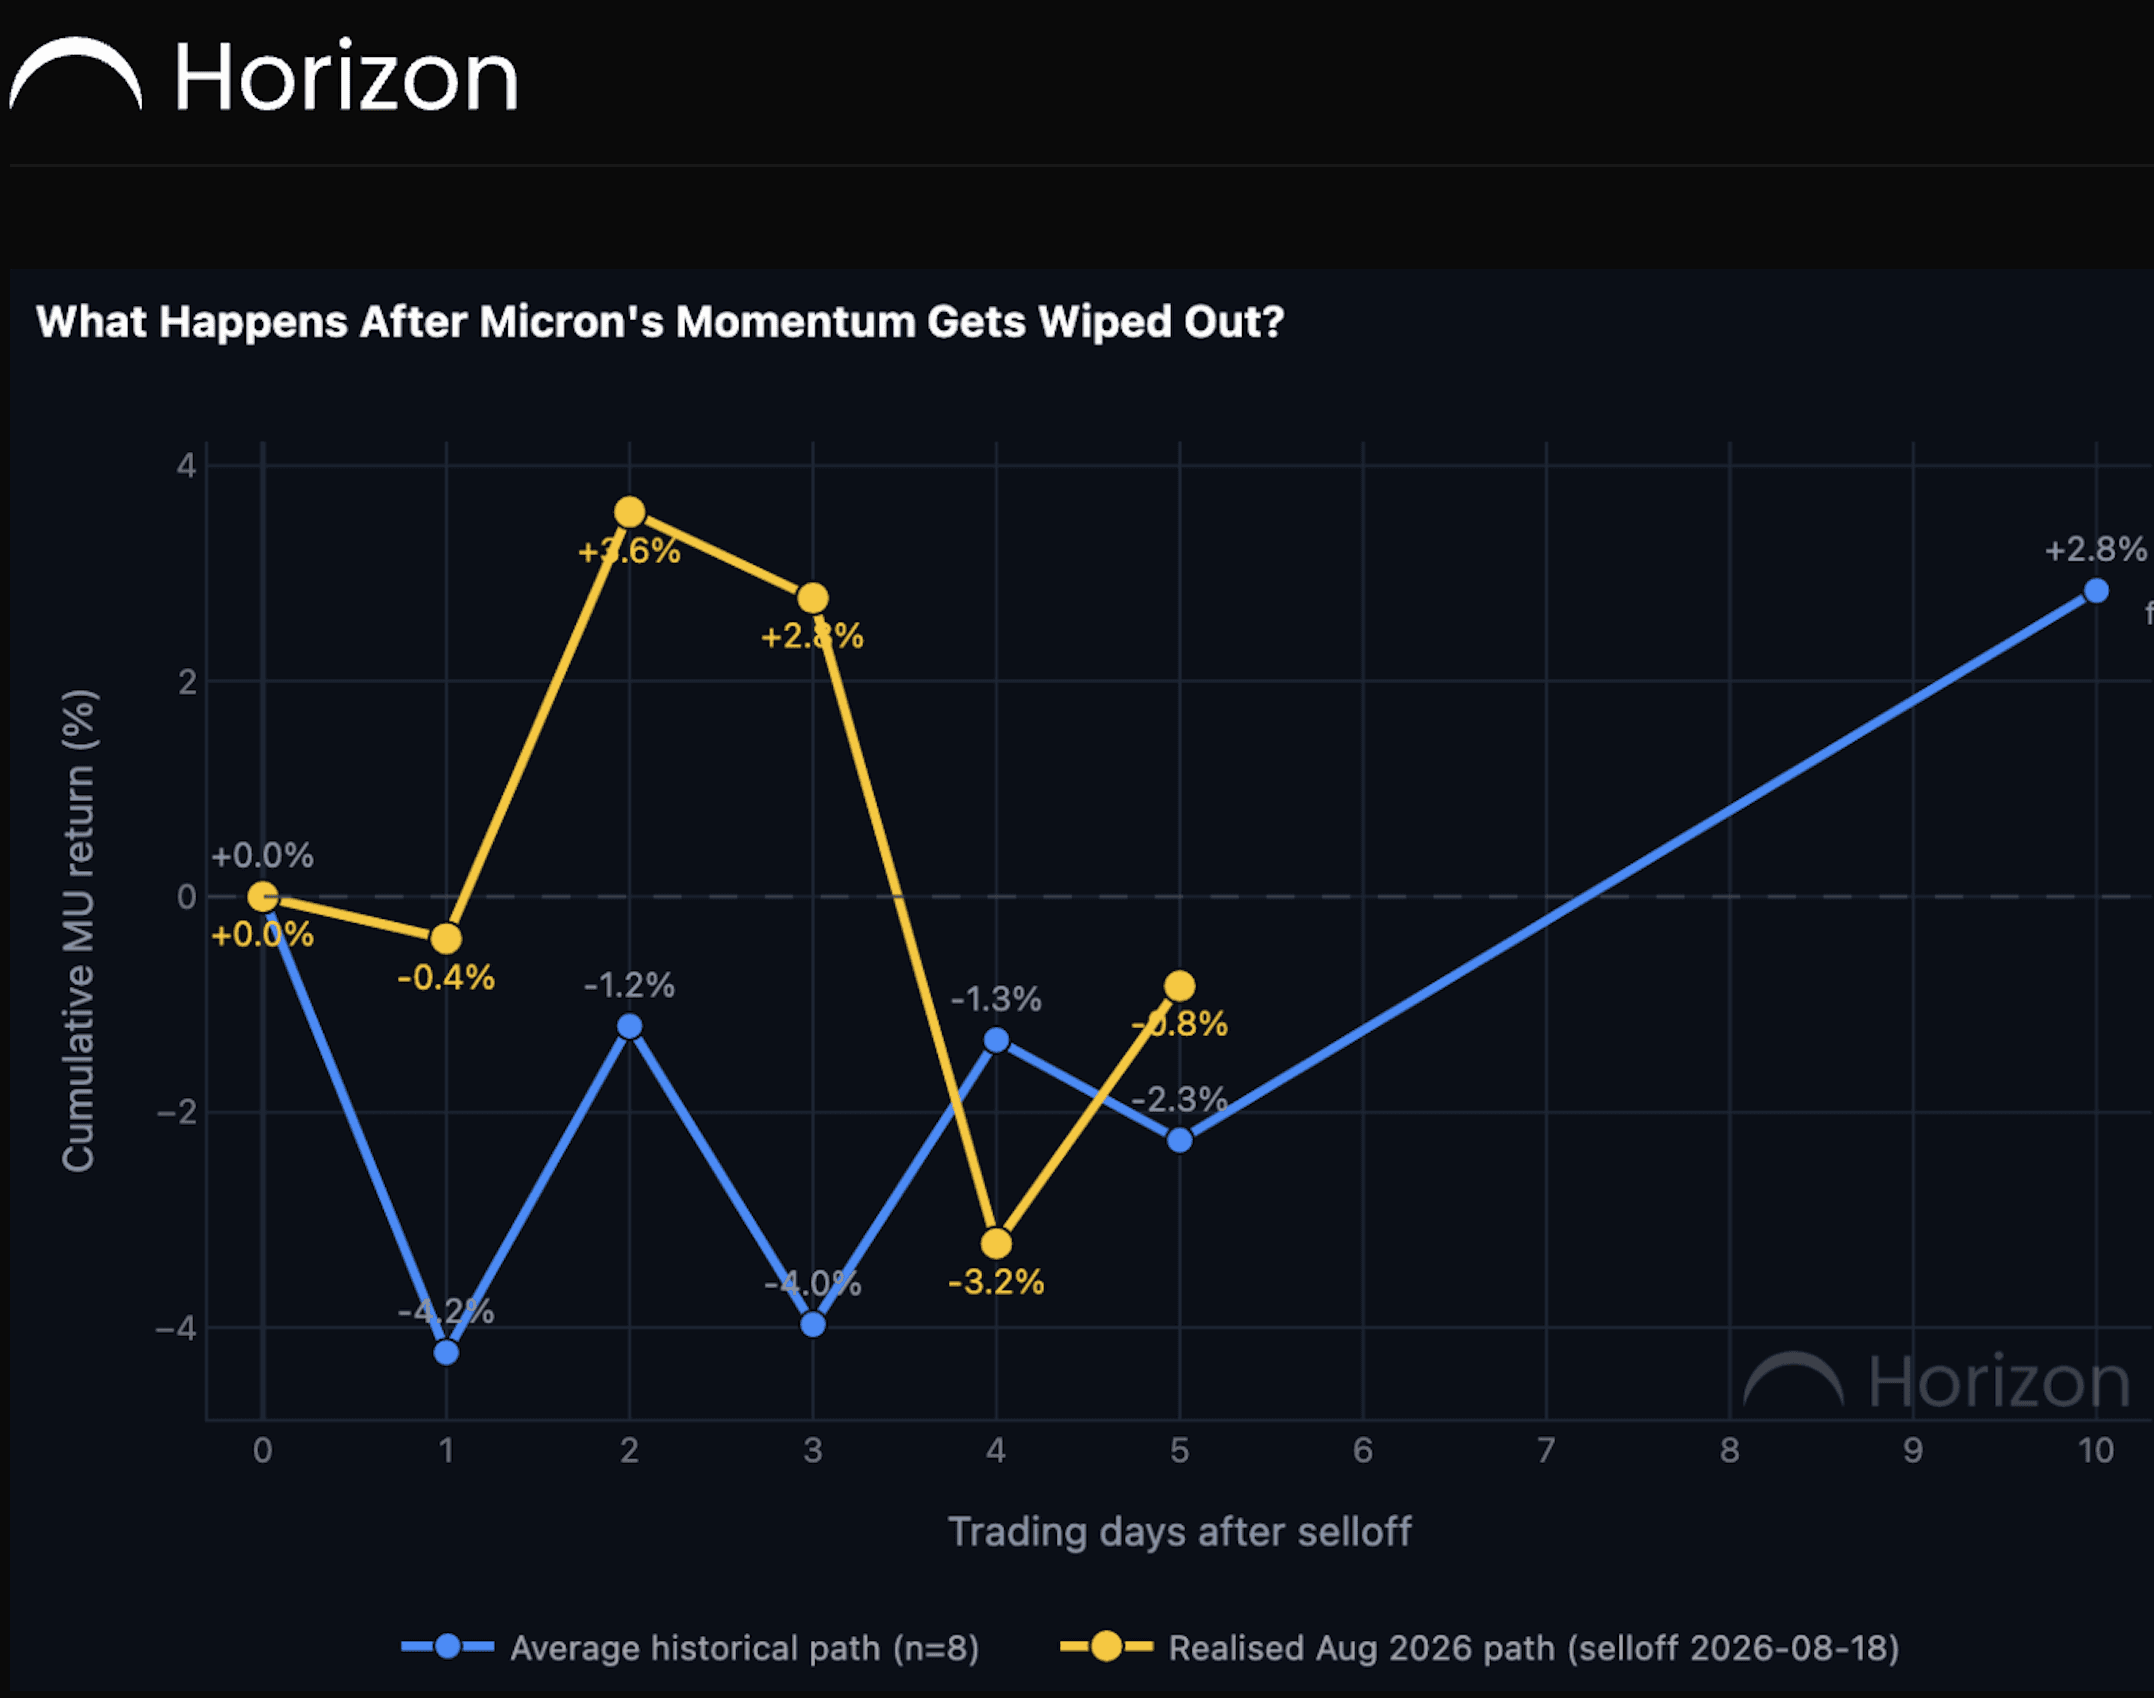
Micron rallied 17.51% over five trading days and then dropped 7.02% in a single session.
That combination created a specific historical setup: a strong momentum burst followed by a sharp one-day wipeout.
The original study showed a two-stage pattern.
Weakness usually persisted through the first week.
Then the stock tended to recover into Day +10.
Five days into the current event, the first part has now shown up.
The live path took a different route
Across the eight prior events, the average path was:
- Day +1: -4.23%
- Day +5: -2.26%
- Day +10: +2.84%
The August event did not follow that path smoothly.
The live returns were:
- Day +1: -0.39%
- Day +2: +3.57%
- Day +3: +2.77%
- Day +4: -3.22%
- Day +5: -0.83%
So the stock initially bounced much harder than history suggested.
By the end of the first week, however, the weakness had appeared.
The first half of the pattern is now in place
The original result was never simply that Micron should keep falling.
The historical tendency was first-week weakness followed by a rebound.
That distinction matters now.
At Day +5, the live event sits at -0.83%.
That is less negative than the historical average of -2.26%, but the direction has converged.
The more interesting part of the study now begins.
Days 6 to 10 are the real test
Historically, the average path improved from -2.26% on Day +5 to +2.84% by Day +10.
That is a five-percentage-point swing in the second half of the window.
If the current event follows the full historical pattern, the next move should be the recovery phase.
If it does not, the live setup will have matched the first-week weakness without delivering the historical rebound.
Why live tracking matters
Event studies can become too neat when only the average line is shown.
The current Micron path demonstrates that the route can differ significantly even when the end-of-week result eventually moves toward the historical tendency.
That is why the forward path is worth tracking session by session.
The takeaway
Five days after Micron's momentum wipeout, the first-week weakness has caught up with the historical pattern.
The stock is down 0.83% from the event close at Day +5.
The historical study becomes more interesting from here.
Prior events tended to rebound sharply between Day +5 and Day +10.
The next five sessions will show whether this setup completes the pattern or breaks from it.
Share this post: