On August 17, the U.S. Treasury announced it would double long-end liquidity-support buybacks from $2 billion to at least $4 billion per operation.
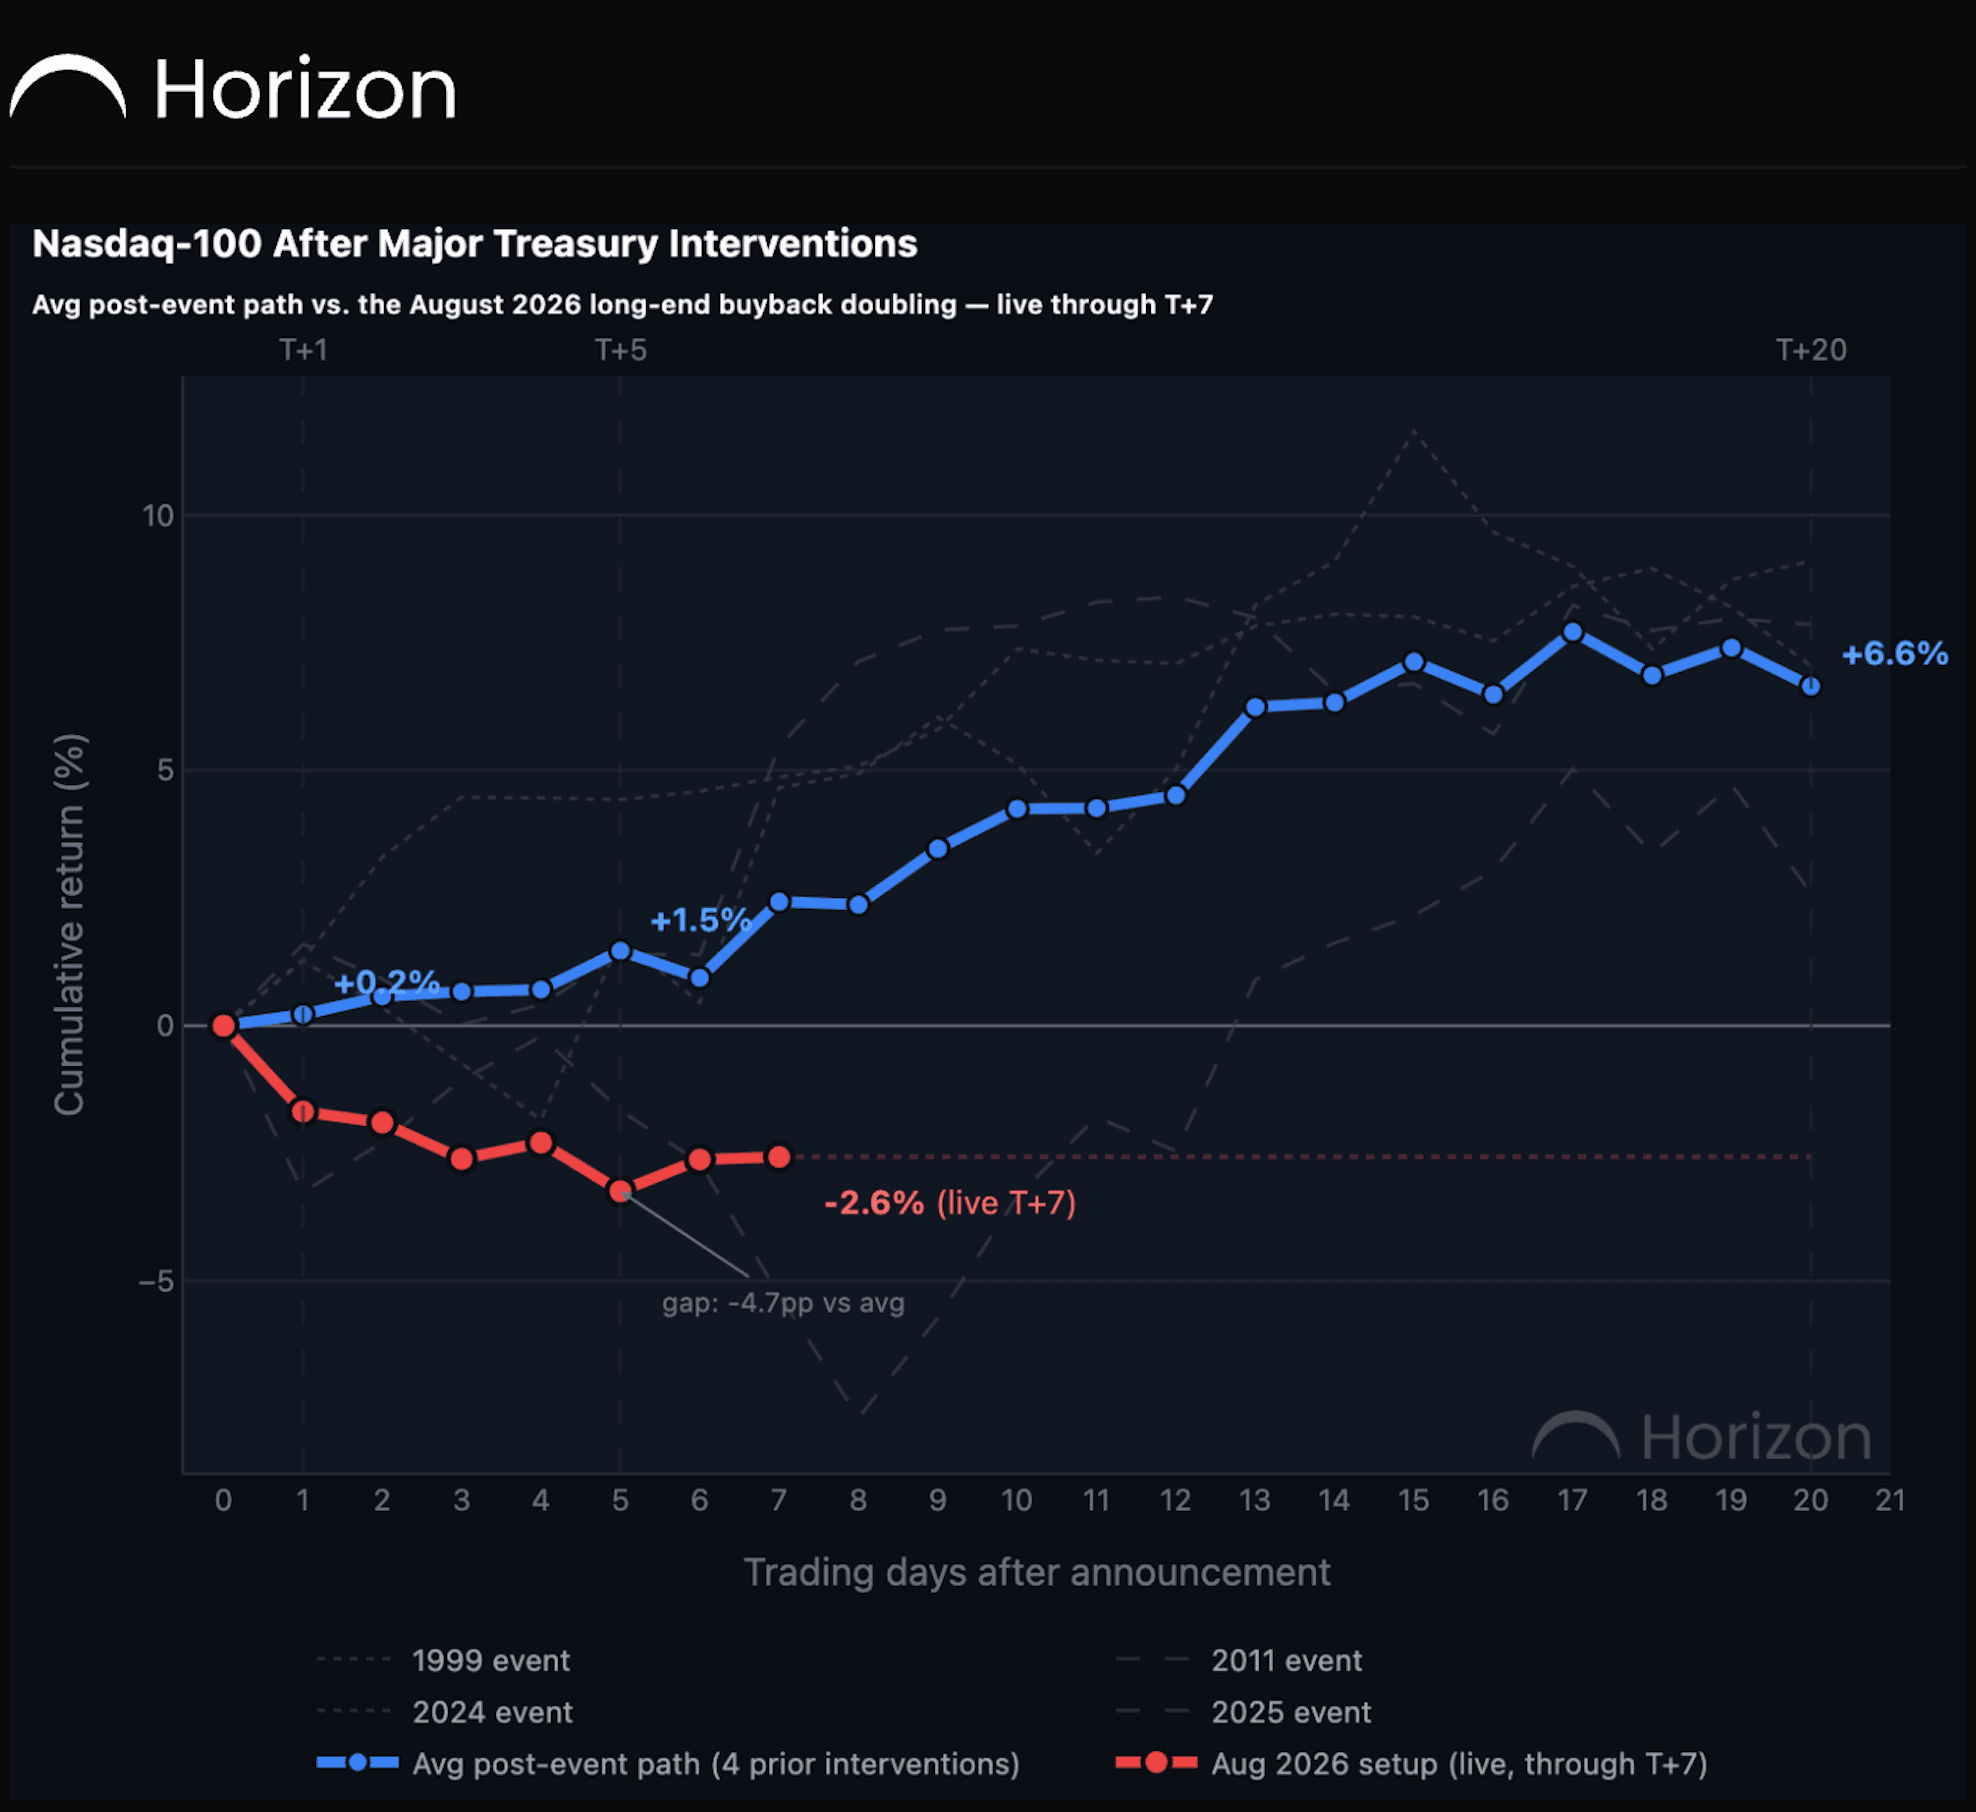
Historically, the Nasdaq-100 performed well after four comparable long-end interventions.
The average return was +1.47% by T+5 and +6.65% by T+20.
The 2026 event is doing the opposite.
Seven days in, the gap is large
Through T+7, the Nasdaq-100 is down 2.57% from the announcement-day close.
The historical average at the same point is +2.43%.
That creates a gap of roughly five percentage points.
| Trading day | Historical avg | Aug 2026 |
|---|---|---|
| T+1 | +0.22% | -1.68% |
| T+5 | +1.47% | -3.24% |
| T+7 | +2.43% | -2.57% |
| T+20 | +6.65% | Pending |
The expected convergence has not started yet.
The live path deteriorated into T+5 before stabilising around -2.6% at T+6 and T+7.
The historical strength came later
The four-event historical average accelerated after the first week.
It moved from +1.47% at T+5 to +6.65% by T+20.
That leaves open the possibility of a delayed recovery.
There is historical precedent.
The weakest prior event, 2011's Operation Twist, fell to roughly -7.7% at T+8 before recovering to +2.6% by T+20.
The 2026 event has a lot of ground to make up
Matching the historical T+20 average from the current T+7 level would require roughly a 9.2% rally over the next 13 sessions.
That is possible.
It is also a large move.
The important point is that the current path is no longer merely "a little behind" the historical average.
It is a clear outlier.
Why live follow-ups matter
Historical averages can look clean when the final outcome is known.
Real-time tracking shows how messy the path can be.
The current event is useful precisely because it is not following the script so far.
If the late reversal appears, it strengthens the case that the historical pattern is simply delayed.
If it does not, the 2026 event becomes the first major break from the four-event sample.
The takeaway
The historical post-intervention pattern remains positive over the full 20-day window.
The live 2026 path does not.
At T+7, the Nasdaq-100 is roughly five percentage points behind the historical average.
The next two weeks will determine whether this is a delayed version of the old pattern or a genuine break from it.
Share this post: