
Only about half of S&P 500 stocks are currently trading above their 200-day moving average, even while the index remains close to record highs.
That looks uncomfortable.
A market making new highs while a large share of its constituents sit in long-term downtrends is exactly the kind of narrowing participation investors tend to treat as a warning.
The historical record is more complicated.
What we tested
We looked for periods where the S&P 500 was within 2% of its rolling all-time high while only 35% to 60% of constituents were above their own 200-day moving average.
That means roughly 40% to 65% of the index was below its long-term trend even as the headline index remained near a record.
A 21-trading-day cooldown was used to separate clustered signals.
That produced 41 episodes from March 2013 through June 2026.
Most of these signals did not lead to an immediate breakdown
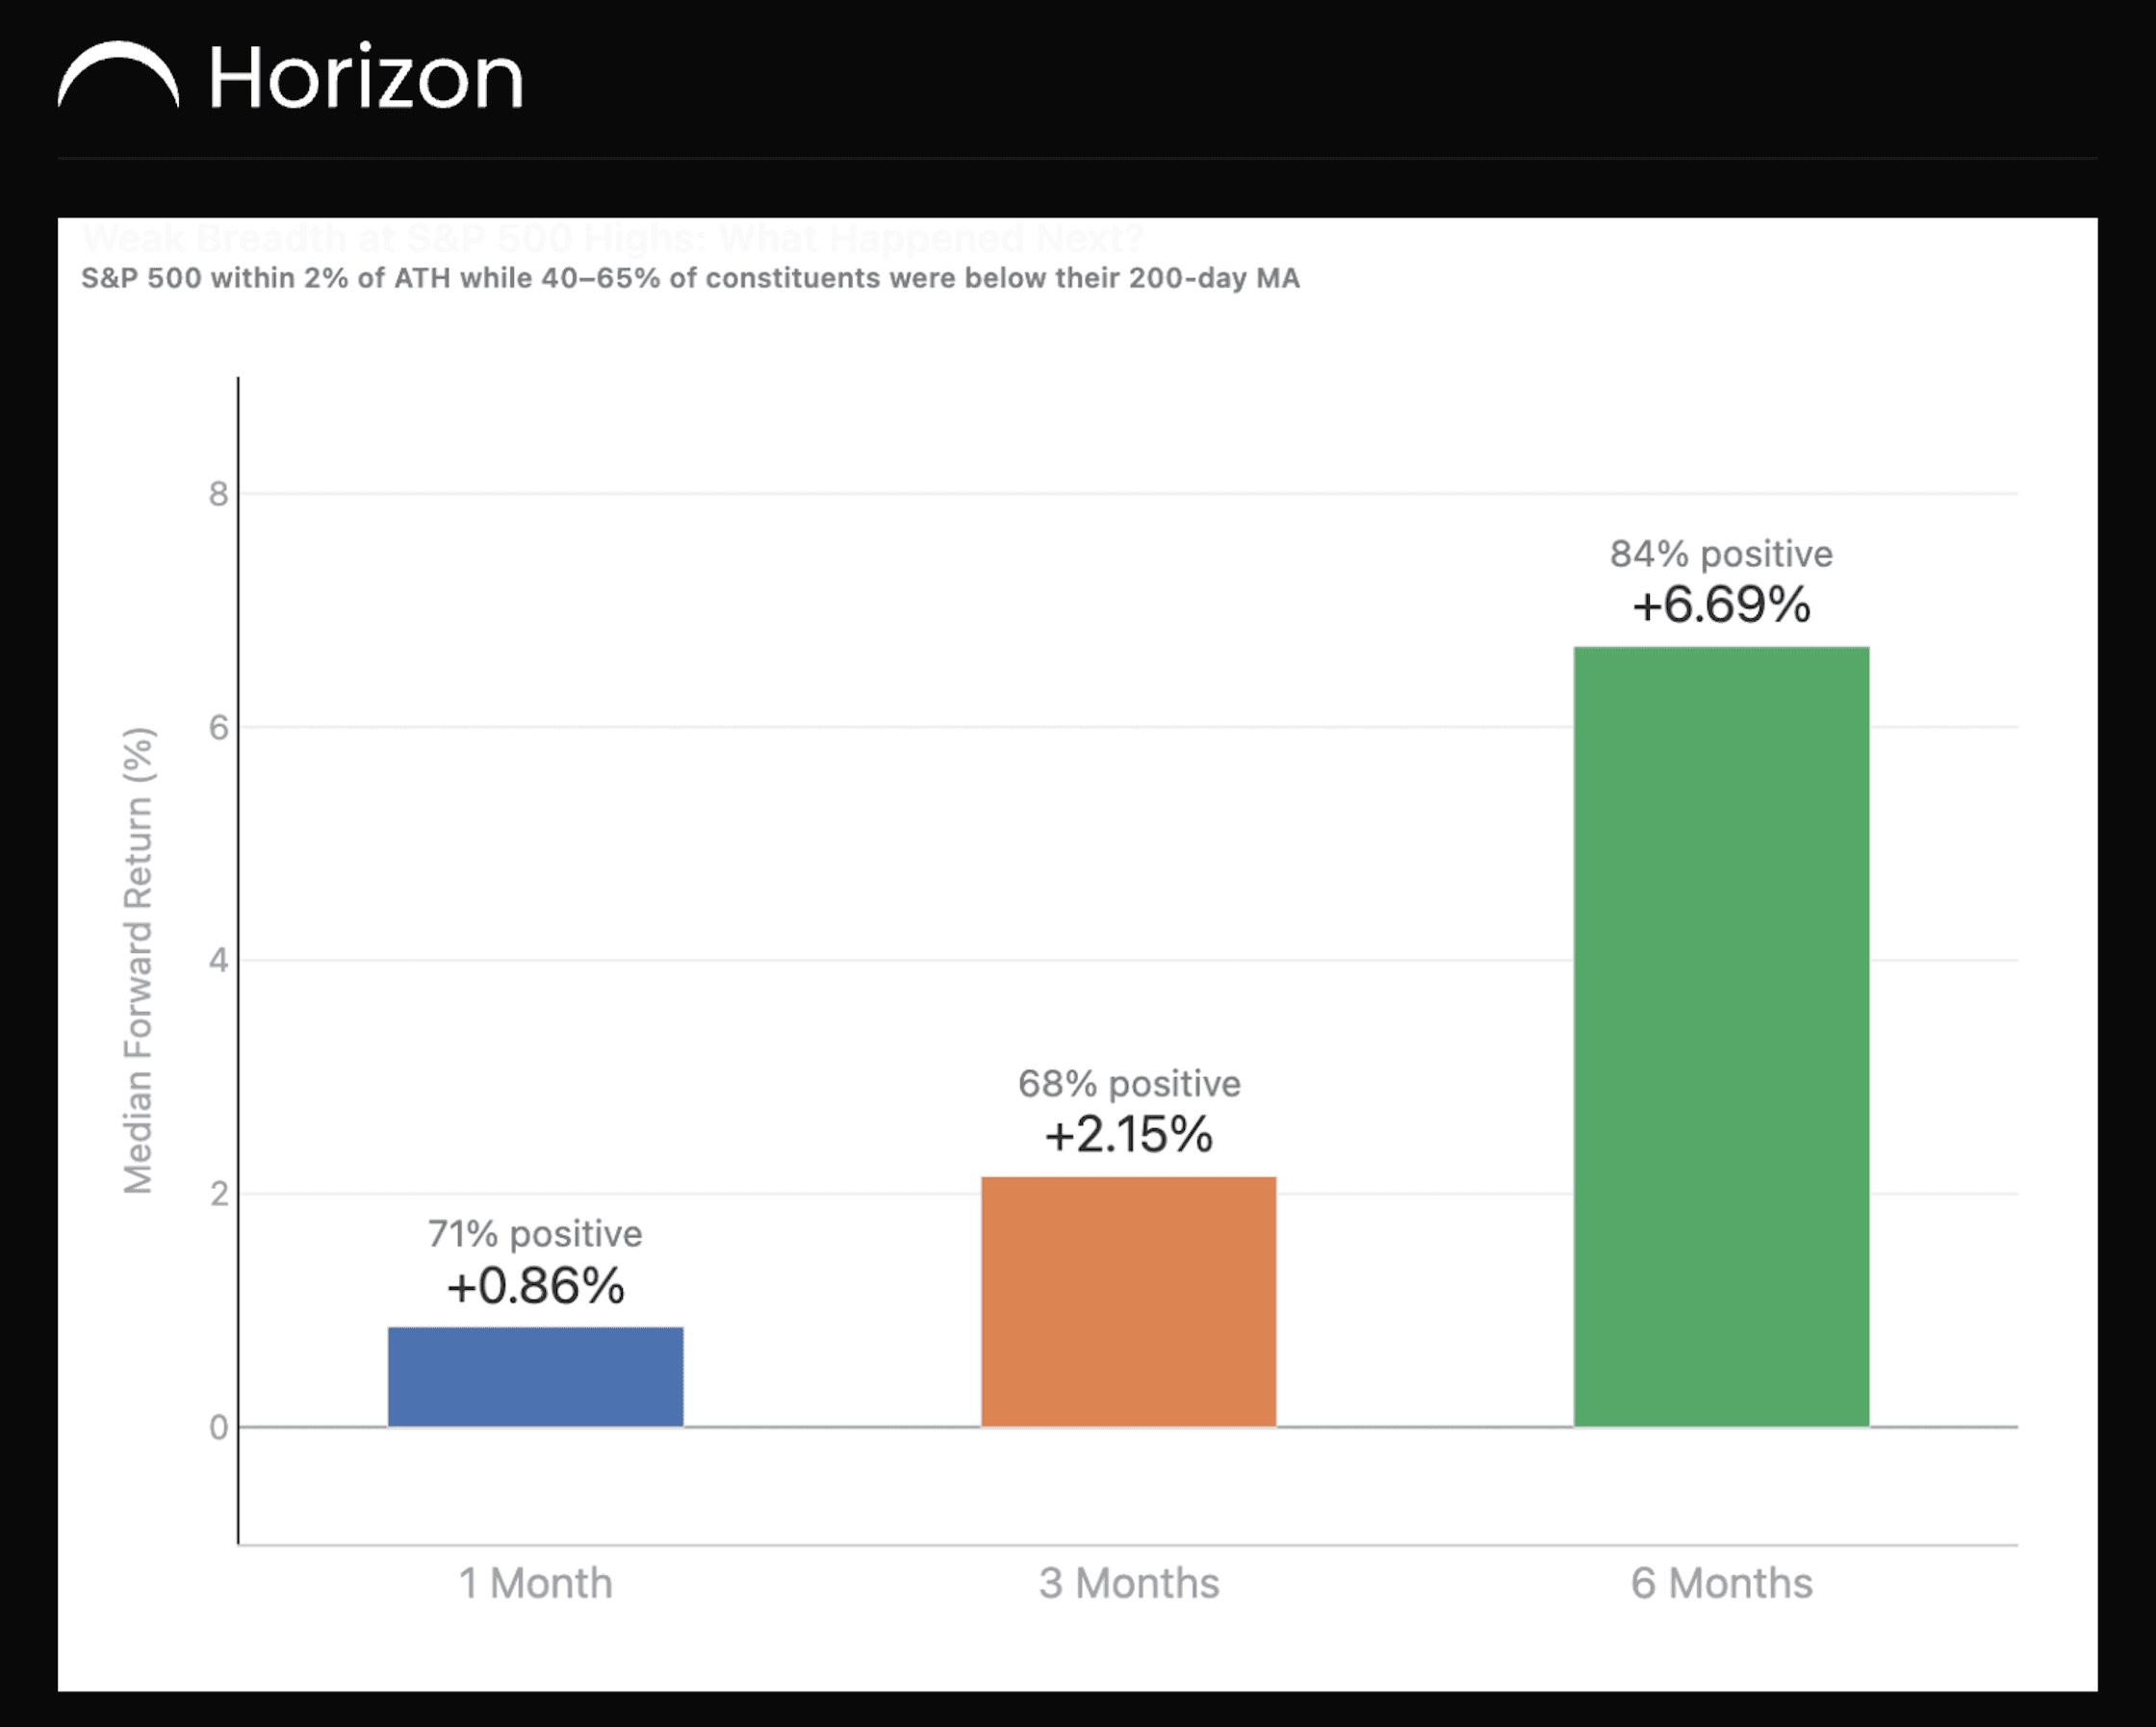
The median S&P 500 return one month after a breadth-divergence signal was +0.86%.
After three months, the median return increased to +2.15%.
After six months, it reached +6.69%.
The hit rate became even more interesting over the longer horizon.
The S&P 500 was positive after 71% of the one-month periods, 68% of the three-month periods and 84% of the six-month periods.
That is difficult to reconcile with the idea that weak breadth near a market high is automatically a sell signal.
Weak breadth can persist while the index keeps rising
The simplest explanation is that a narrow market can remain narrow for longer than expected.
A small group of large companies can continue carrying a capitalization-weighted index even while the average stock struggles.
Alternatively, participation can eventually broaden and allow the rest of the market to catch up.
Either way, breadth deterioration alone has not historically provided precise timing for a market top in this sample.
That does not make the signal useless.
It changes what the signal is telling us.
The bad episodes looked different
The average outcome was positive, but the downside tail still mattered.
Some of the weakest historical episodes produced substantial losses over the following six months.
The more concerning cases were associated with breadth deteriorating more deeply and remaining weak for an extended period.
That distinction matters.
There is a difference between an index becoming temporarily narrow and a market where participation continues deteriorating while the headline index holds up.
The first has often resolved without a major correction.
The second deserves more attention.
One important limitation
This study uses the current S&P 500 constituent list to reconstruct historical breadth.
That introduces survivorship bias because companies that left the index are not represented in earlier periods.
The constituent data also begins in 2012, so the sample does not include major historical breadth divergences around the 2000 or 2007 market peaks.
The results should therefore be read as evidence from the post-2012 market, not a complete history of every major market cycle.
The takeaway
Weak breadth near an all-time high looks bearish.
Historically, it has been a poor standalone timing signal.
Across 41 post-2012 episodes, the median S&P 500 return six months later was +6.69%, and 84% of observations were positive.
The more useful question is not whether breadth is weak today.
It is whether participation stabilises from here or continues deteriorating.
Breadth can be a warning.
It has not been a reliable countdown clock.
Share this post: