The U.S. Treasury has stepped in to support the long end of the bond market.
Buyback operations across 10 to 30-year maturities were increased from $2 billion to at least $4 billion per operation.
The immediate Nasdaq reaction was weak.
History suggests the larger move, when it comes, tends to appear later.
Four comparable interventions
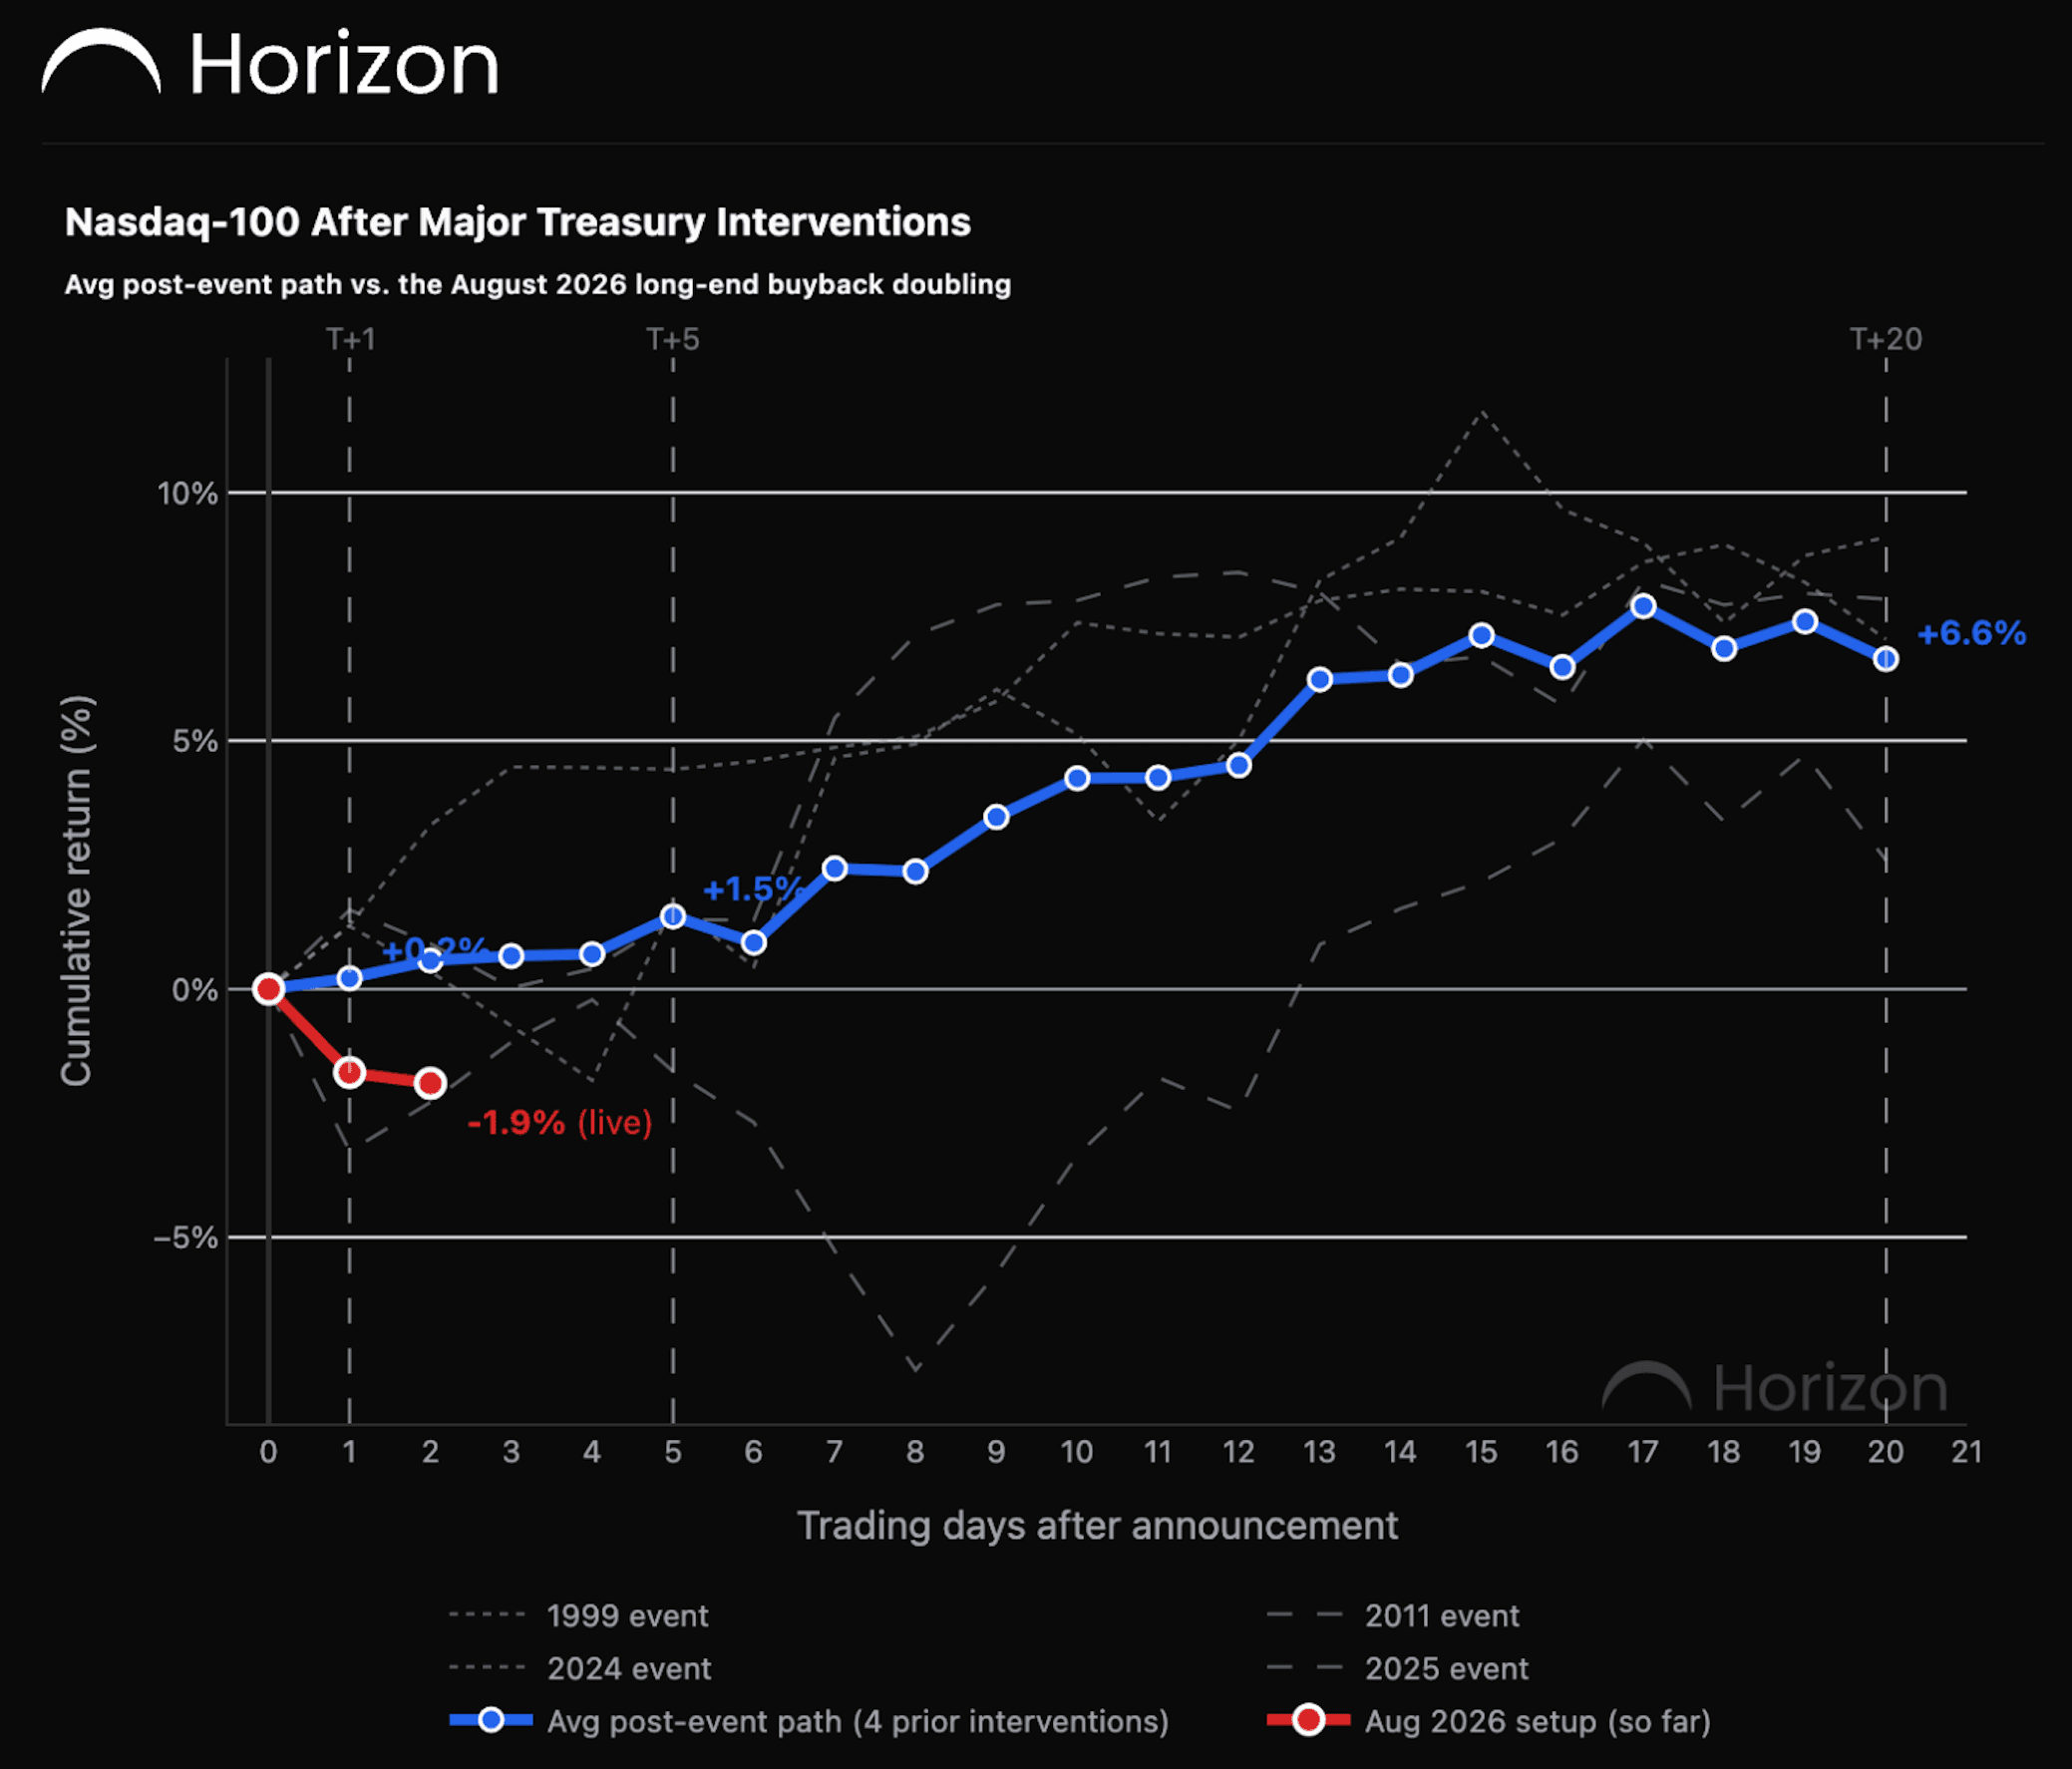
We looked at four major Treasury long-end interventions since 1999.
The average Nasdaq-100 path was:
- T+1: +0.2%
- T+5: +1.5%
- T+20: +6.7%
The progression matters.
The historical edge was not an immediate Day 1 bounce.
It was the gradual improvement over the following month.
One historical event was initially very weak
The major exception was Operation Twist in September 2011.
That intervention landed during the Eurozone crisis.
The Nasdaq initially sold off hard.
Even so, the event recovered to finish +2.6% by T+20.
That is important because it shows that a weak first reaction did not automatically invalidate the broader historical pattern.
The August 2026 setup
The current event is down 1.9% through T+2.
That looks poor in isolation.
Relative to the historical sample, it still sits within the range of prior outcomes.
The more important comparison is what happens over the next five to 20 trading days.
That is where the historical average became much stronger.
Why long-end support can matter for tech
Treasury intervention can improve liquidity and reduce pressure at the long end of the curve.
Lower long-term yields can ease the discount-rate pressure applied to growth equities.
Technology stocks are especially sensitive to that dynamic because more of their value depends on future cash flows.
The policy action does not guarantee a rally.
It changes the financial conditions around the market.
The sample is small
There are only four comparable events.
That is nowhere near enough to treat the pattern as a statistically robust trading edge.
The value of the study is as a framework.
It tells us which window has historically mattered and how to compare the live path with prior interventions.
The takeaway
Treasury long-end interventions have historically been more useful as a medium-term liquidity signal than as a one-day trade.
Across four prior events, the Nasdaq-100 averaged only +0.2% at T+1 but +6.7% by T+20.
The current event is weak through T+2.
History suggests the more relevant test comes over the next several weeks.
Share this post: